# Technical Document Extraction: Conductance vs. Twisting Angle for MoSe₂ and WSe₂
## Graph (b): MoSe₂, E_F = -0.095 meV
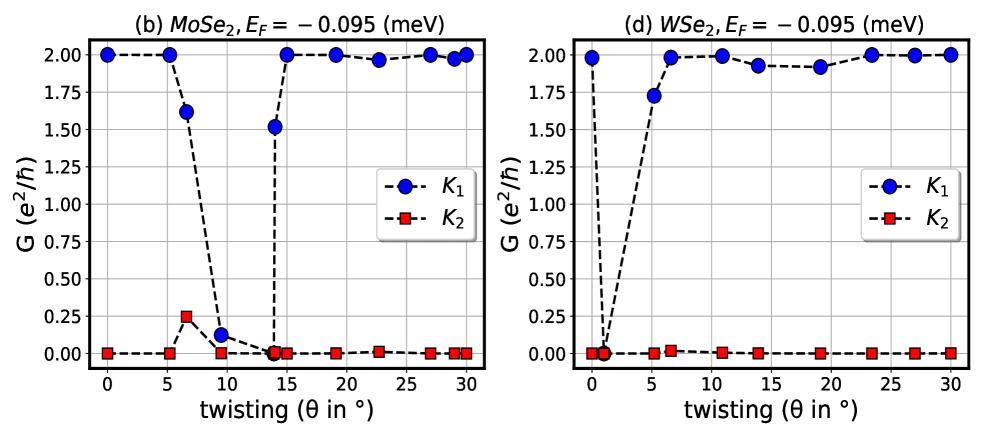
- **Title**: Conductance (G) vs. Twisting Angle (θ) for MoSe₂ at E_F = -0.095 meV
- **Axes**:
- **X-axis**: Twisting angle (θ) in degrees (°), ranging from 0 to 30°.
- **Y-axis**: Conductance (G) in units of e²/h, ranging from 0.00 to 2.00.
- **Legend**:
- **K₁**: Blue circles (solid line).
- **K₂**: Red squares (dashed line).
- **Data Trends**:
- **K₁ (Blue Circles)**:
- Starts at 2.00 e²/h at θ = 0°.
- Drops sharply to 1.50 e²/h at θ = 5°.
- Further decreases to 0.00 e²/h at θ = 10°.
- Remains at 0.00 e²/h for θ ≥ 10°.
- **K₂ (Red Squares)**:
- Starts at 0.00 e²/h at θ = 0°.
- Peaks at 0.25 e²/h at θ = 5°.
- Returns to 0.00 e²/h at θ = 10°.
- Remains at 0.00 e²/h for θ ≥ 10°.
## Graph (d): WSe₂, E_F = -0.095 meV
- **Title**: Conductance (G) vs. Twisting Angle (θ) for WSe₂ at E_F = -0.095 meV
- **Axes**:
- **X-axis**: Twisting angle (θ) in degrees (°), ranging from 0 to 30°.
- **Y-axis**: Conductance (G) in units of e²/h, ranging from 0.00 to 2.00.
- **Legend**:
- **K₁**: Blue circles (solid line).
- **K₂**: Red squares (dashed line).
- **Data Trends**:
- **K₁ (Blue Circles)**:
- Starts at 2.00 e²/h at θ = 0°.
- Drops sharply to 1.75 e²/h at θ = 5°.
- Further decreases to 0.00 e²/h at θ = 10°.
- Remains at 0.00 e²/h for θ ≥ 10°.
- **K₂ (Red Squares)**:
- Starts at 0.00 e²/h at θ = 0°.
- Peaks at 0.05 e²/h at θ = 5°.
- Returns to 0.00 e²/h at θ = 10°.
- Remains at 0.00 e²/h for θ ≥ 10°.
## Key Observations
1. **Material-Specific Behavior**:
- **MoSe₂ (Graph b)**:
- K₁ exhibits a larger initial drop (2.00 → 1.50 e²/h) compared to WSe₂ (2.00 → 1.75 e²/h).
- K₂ shows a more pronounced peak (0.25 e²/h) in MoSe₂ vs. WSe₂ (0.05 e²/h).
- **WSe₂ (Graph d)**:
- K₁ retains higher conductance (1.75 e²/h at θ = 5°) compared to MoSe₂.
- K₂’s peak is significantly smaller (0.05 e²/h) in WSe₂.
2. **Critical Twisting Angles**:
- Both materials show abrupt conductance drops at θ = 10°, indicating a structural or electronic transition.
- K₂ peaks at θ = 5° in both materials but with differing magnitudes.
3. **Energy Alignment**:
- Both graphs share the same Fermi energy (E_F = -0.095 meV), suggesting comparative analysis under identical electronic conditions.