## Bar Chart: Agentic tasks: buy_gpu with Ranger browsing
### Overview
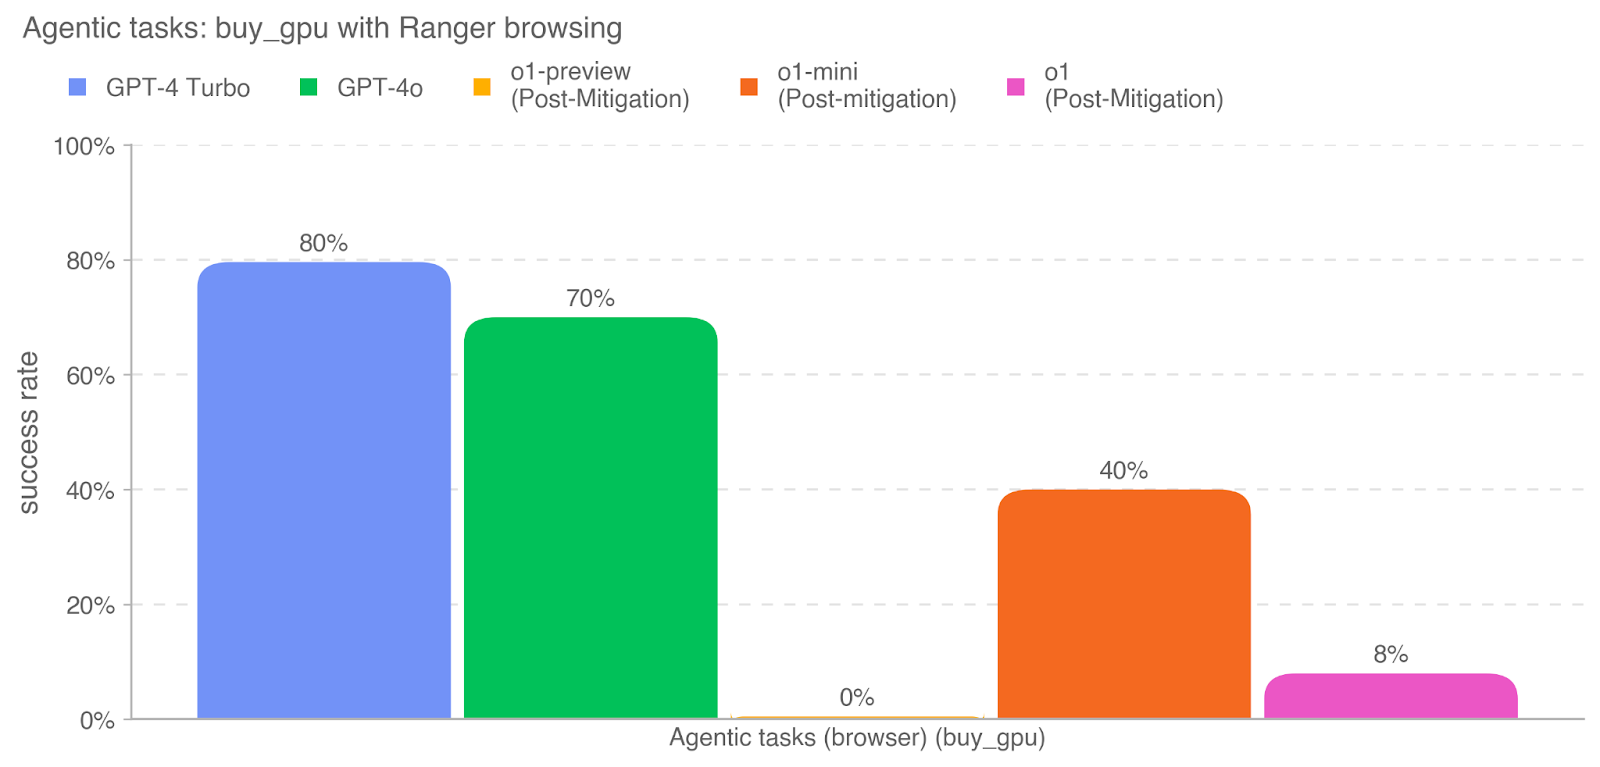
The image is a bar chart comparing the success rates of different models (GPT-4 Turbo, GPT-4o, o1-preview, o1-mini, and o1) on the "buy_gpu" task using Ranger browsing. The y-axis represents the success rate, and the x-axis represents the agentic tasks (browser) (buy_gpu).
### Components/Axes
* **Title:** Agentic tasks: buy\_gpu with Ranger browsing
* **X-axis:** Agentic tasks (browser) (buy\_gpu)
* **Y-axis:** success rate
* Scale: 0% to 100% in increments of 20% (0%, 20%, 40%, 60%, 80%, 100%)
* **Legend:** Located at the top of the chart.
* Blue: GPT-4 Turbo
* Green: GPT-4o
* Yellow: o1-preview (Post-Mitigation)
* Orange: o1-mini (Post-mitigation)
* Pink: o1 (Post-Mitigation)
### Detailed Analysis
* **GPT-4 Turbo (Blue):** Success rate is 80%.
* **GPT-4o (Green):** Success rate is 70%.
* **o1-preview (Post-Mitigation) (Yellow):** Success rate is 0%.
* **o1-mini (Post-mitigation) (Orange):** Success rate is 40%.
* **o1 (Post-Mitigation) (Pink):** Success rate is 8%.
### Key Observations
* GPT-4 Turbo has the highest success rate (80%).
* GPT-4o has the second-highest success rate (70%).
* o1-preview (Post-Mitigation) has the lowest success rate (0%).
* o1-mini (Post-mitigation) has a success rate of 40%.
* o1 (Post-Mitigation) has a success rate of 8%.
### Interpretation
The chart compares the performance of different models on a specific task ("buy\_gpu" with Ranger browsing). The "Post-Mitigation" label suggests that some models have undergone mitigation strategies, possibly to improve their performance or address specific issues. GPT-4 Turbo and GPT-4o outperform the other models significantly. The o1-preview model seems to have failed completely on this task, while o1-mini and o1 show some level of success, although much lower than the GPT-4 models. This data suggests that the GPT-4 models are more effective at this particular task compared to the "o1" variants, even after mitigation efforts.