\n
## Bar Chart: Success Rate of Agentic Tasks (buy_gpu with Ranger browsing)
### Overview
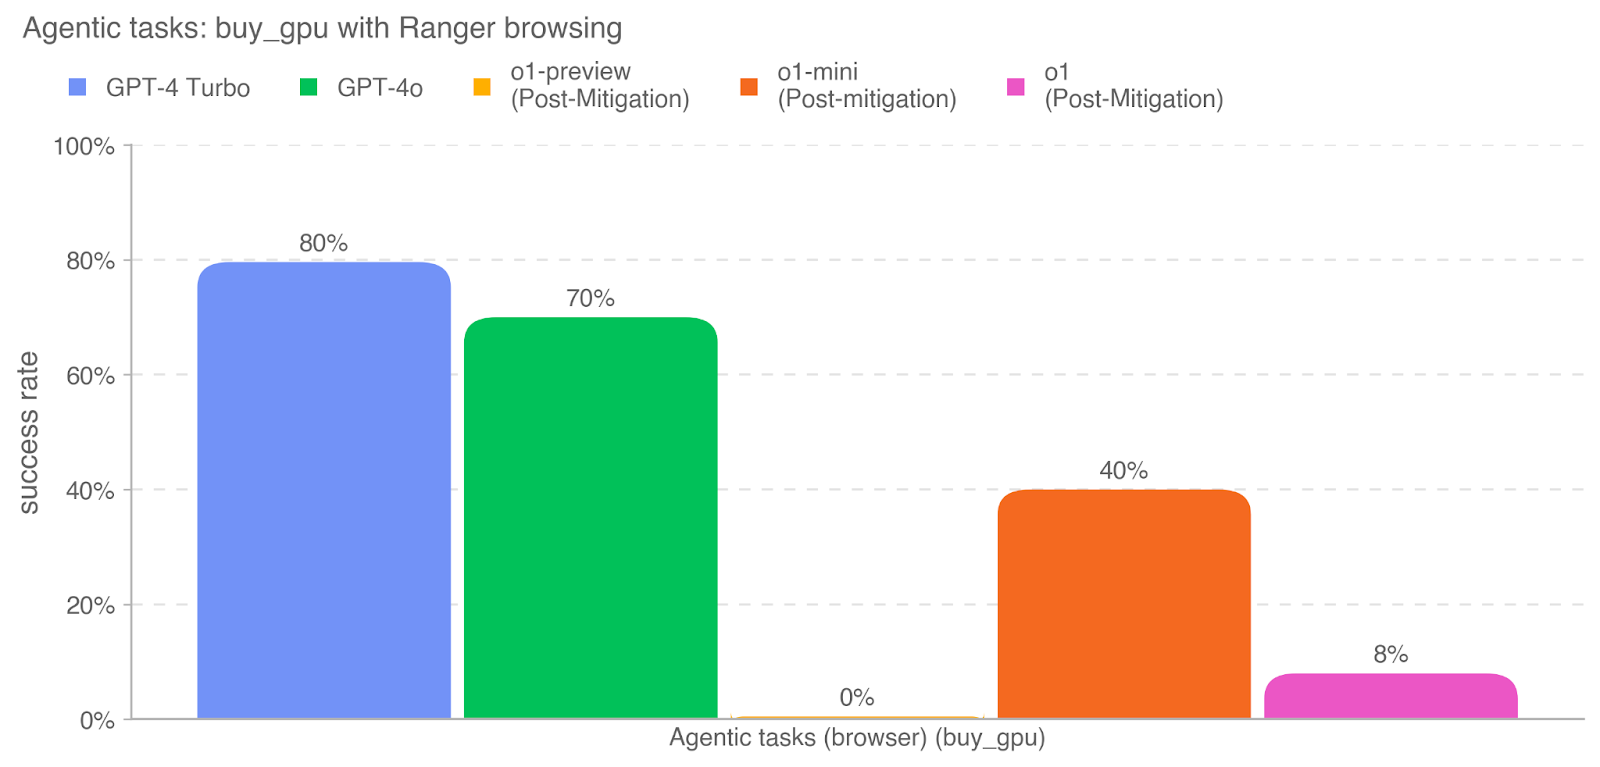
This bar chart displays the success rate of different language models (GPT-4 Turbo, GPT-4o, o1-preview, o1-mini, and o1) performing the agentic task of buying a GPU using Ranger browsing. The success rate is measured as a percentage, ranging from 0% to 100%. The chart visually compares the performance of these models, with some models having undergone post-mitigation adjustments.
### Components/Axes
* **Title:** "Agentic tasks: buy\_gpu with Ranger browsing" (top-center)
* **X-axis Label:** "Agentic tasks (browser) (buy\_gpu)" (bottom-center)
* **Y-axis Label:** "success rate" (left-center)
* **Y-axis Scale:** 0% to 100%, with gridlines at 20%, 40%, 60%, 80%, and 100%.
* **Legend:** Located at the top-right of the chart.
* GPT-4 Turbo (Blue)
* GPT-4o (Green)
* o1-preview (Post-Mitigation) (Orange)
* o1-mini (Post-mitigation) (Yellow)
* o1 (Post-Mitigation) (Magenta)
### Detailed Analysis
The chart consists of five bars, each representing the success rate of a different model.
* **GPT-4 Turbo:** The bar is blue and reaches approximately 80% on the y-axis.
* **GPT-4o:** The bar is green and reaches approximately 70% on the y-axis.
* **o1-preview (Post-Mitigation):** The bar is orange and reaches approximately 40% on the y-axis.
* **o1-mini (Post-mitigation):** The bar is yellow and reaches 0% on the y-axis.
* **o1 (Post-Mitigation):** The bar is magenta and reaches approximately 8% on the y-axis.
### Key Observations
* GPT-4 Turbo exhibits the highest success rate at approximately 80%.
* GPT-4o has a slightly lower success rate at approximately 70%.
* The "o1" models, even after post-mitigation, demonstrate significantly lower success rates. o1-mini has a 0% success rate.
* The post-mitigation adjustments do not appear to have substantially improved the success rates of the "o1" models.
### Interpretation
The data suggests that GPT-4 Turbo and GPT-4o are significantly more effective at completing the "buy\_gpu" task with Ranger browsing than the "o1" models. The substantial difference in success rates indicates that the "o1" models may require further development or different mitigation strategies to achieve comparable performance. The fact that post-mitigation did not drastically improve the "o1" models suggests that the underlying issues are more fundamental than easily addressable through simple adjustments. The 0% success rate for o1-mini is a notable outlier, indicating a complete failure in completing the task. This could be due to a variety of factors, including limitations in the model's capabilities, issues with the browsing integration, or problems with the task definition itself. The chart provides a clear comparison of the performance of different language models in a specific agentic task, highlighting the strengths and weaknesses of each model.