## Bar Chart: Agentic tasks: buy_gpu with Ranger browsing
### Overview
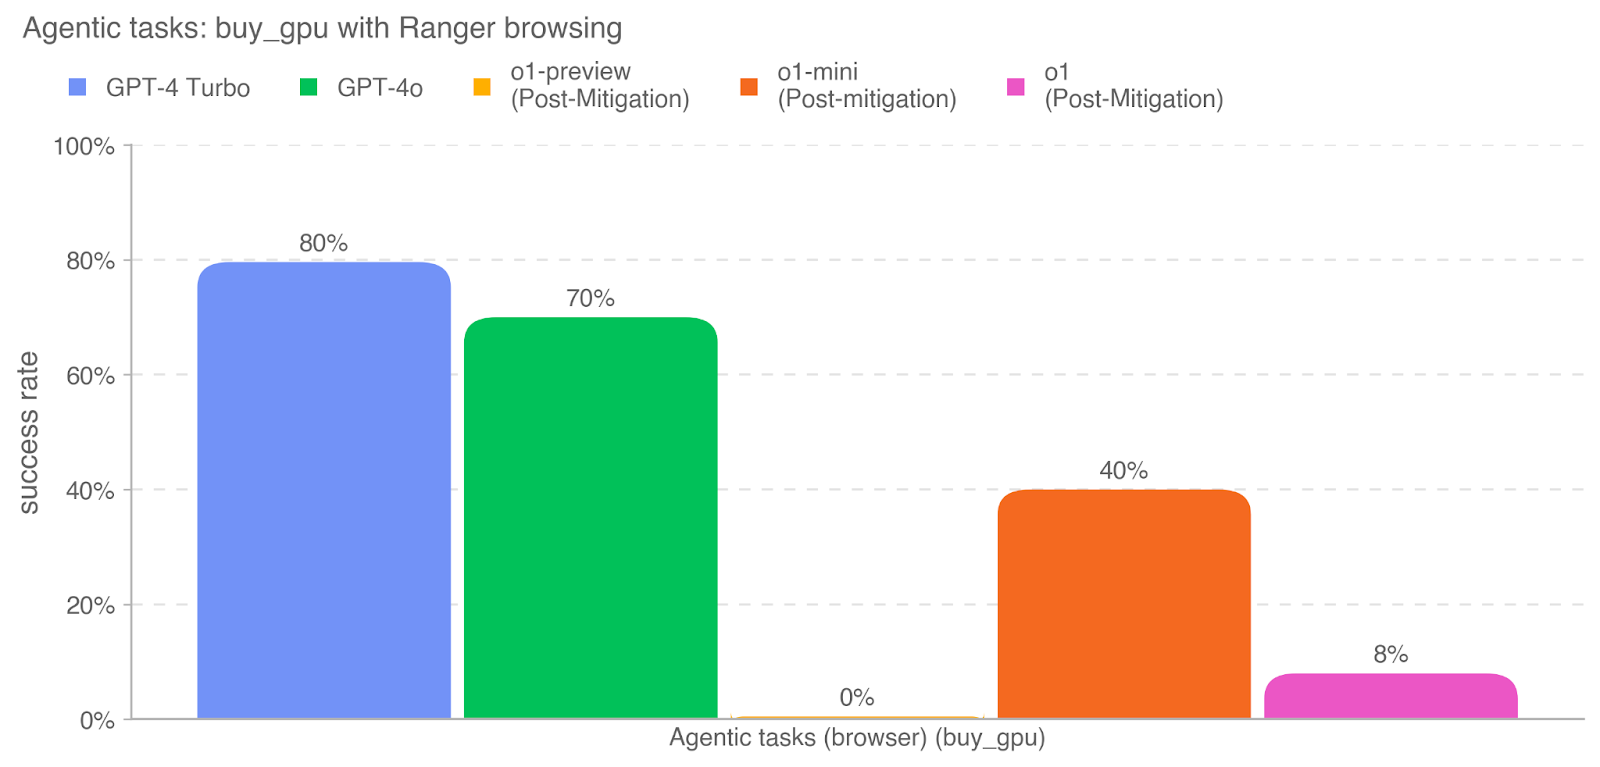
The image is a vertical bar chart comparing the success rates of five different AI models on a specific agentic task labeled "buy_gpu" using "Ranger browsing." The chart displays performance as percentages, with each model represented by a distinct colored bar.
### Components/Axes
* **Chart Title:** "Agentic tasks: buy_gpu with Ranger browsing" (located at the top-left).
* **Y-Axis:** Labeled "success rate." The scale runs from 0% to 100% in increments of 20% (0%, 20%, 40%, 60%, 80%, 100%). Horizontal dashed grid lines extend from each tick mark.
* **X-Axis:** Labeled "Agentic tasks (browser) (buy_gpu)." This axis represents the single task category being evaluated.
* **Legend:** Positioned at the top of the chart, centered horizontally. It contains five entries, each with a colored square and a model name:
* Blue square: `GPT-4 Turbo`
* Green square: `GPT-4o`
* Yellow square: `o1-preview (Post-Mitigation)`
* Orange square: `o1-mini (Post-mitigation)`
* Pink square: `o1 (Post-Mitigation)`
* *Note: The capitalization of "Mitigation" is inconsistent in the original legend text.*
### Detailed Analysis
The chart contains five bars, each corresponding to a model in the legend. The bars are arranged from left to right in the same order as the legend.
1. **GPT-4 Turbo (Blue Bar):**
* **Position:** Leftmost bar.
* **Value:** The bar reaches the 80% grid line. The exact value `80%` is annotated directly above the bar.
* **Trend:** This is the highest-performing model in the comparison.
2. **GPT-4o (Green Bar):**
* **Position:** Second bar from the left.
* **Value:** The bar reaches halfway between the 60% and 80% grid lines. The exact value `70%` is annotated directly above the bar.
* **Trend:** This is the second-highest performing model.
3. **o1-preview (Post-Mitigation) (Yellow Bar):**
* **Position:** Third bar from the left.
* **Value:** The bar has no visible height, sitting at the 0% baseline. The exact value `0%` is annotated directly above the bar's position.
* **Trend:** This model shows no successful completions of the task.
4. **o1-mini (Post-mitigation) (Orange Bar):**
* **Position:** Fourth bar from the left.
* **Value:** The bar reaches the 40% grid line. The exact value `40%` is annotated directly above the bar.
* **Trend:** This model performs moderately, with a success rate half that of GPT-4 Turbo.
5. **o1 (Post-Mitigation) (Pink Bar):**
* **Position:** Rightmost bar.
* **Value:** The bar reaches slightly below the halfway point to the 20% grid line. The exact value `8%` is annotated directly above the bar.
* **Trend:** This model shows very low performance, only slightly above the 0% model.
### Key Observations
* **Performance Hierarchy:** There is a clear and significant performance gap between the GPT-4 series models (Turbo and 4o) and the o1 series models (preview, mini, and standard) on this specific task.
* **Zero Success:** The `o1-preview (Post-Mitigation)` model failed to complete the task successfully in any trial (0% success rate).
* **Mitigation Context:** All three o1-series models are explicitly labeled as "Post-Mitigation," suggesting their performance is being measured after some form of safety or behavioral intervention was applied. The GPT-4 series models lack this label.
* **Task Specificity:** The results are for a single, specific agentic task ("buy_gpu with Ranger browsing"). Performance on other tasks may differ.
### Interpretation
The data suggests that for the complex, browser-based agentic task of "buy_gpu," the GPT-4 Turbo and GPT-4o models are substantially more capable than the evaluated o1-series models in their post-mitigation states. The 0% success rate of o1-preview is a critical outlier, indicating a complete failure mode for that model configuration on this task.
The "Post-Mitigation" label on all o1 models implies a potential trade-off: the applied mitigations, likely aimed at improving safety or alignment, may have severely constrained the models' ability to execute this particular multi-step, real-world task. The chart does not show pre-mitigation performance, so the absolute impact of the mitigations cannot be determined, but the relative underperformance is stark. This highlights a key challenge in AI development: balancing safety interventions with functional capability, especially for agentic systems designed to operate in dynamic environments like a web browser. The results underscore that model performance is highly task-dependent and that interventions can have dramatic, non-uniform effects across different model families and task types.