## Bar Chart: Agentic tasks: buy_gpu with Ranger browsing
### Overview
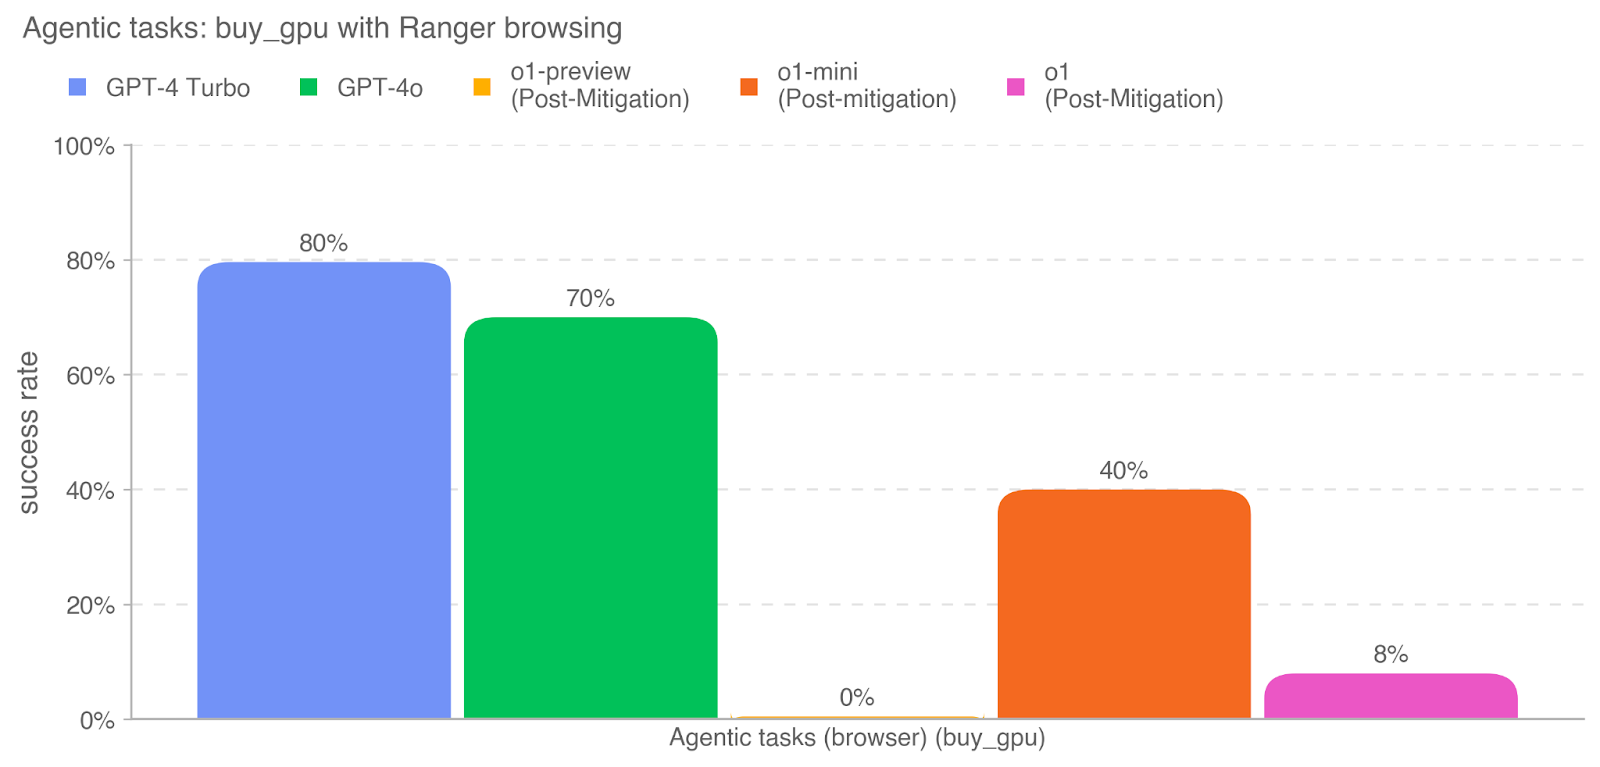
The chart compares the success rates of different AI models or methods for completing the "buy_gpu" task using Ranger browsing. It uses vertical bars to represent performance metrics, with distinct colors for each model/method.
### Components/Axes
- **X-axis**: Labeled "Agentic tasks (browser) (buy_gpu)" with categories:
- GPT-4 Turbo
- GPT-4o
- o1-preview (Post-Mitigation)
- o1-mini (Post-mitigation)
- o1 (Post-Mitigation)
- **Y-axis**: Labeled "Success rate" with a scale from 0% to 100% in 20% increments.
- **Legend**: Located at the top, mapping colors to models/methods:
- Blue: GPT-4 Turbo
- Green: GPT-4o
- Orange: o1-preview (Post-Mitigation)
- Red: o1-mini (Post-mitigation)
- Pink: o1 (Post-Mitigation)
### Detailed Analysis
- **GPT-4 Turbo** (Blue): Tallest bar at **80%** success rate.
- **GPT-4o** (Green): Second tallest at **70%**.
- **o1-preview (Post-Mitigation)** (Orange): Shortest bar at **0%**.
- **o1-mini (Post-mitigation)** (Red): Bar at **40%**.
- **o1 (Post-Mitigation)** (Pink): Smallest bar at **8%**.
### Key Observations
1. **Performance disparity**: GPT-4 Turbo and GPT-4o dominate with 80% and 70% success rates, respectively.
2. **Mitigation impact**: Post-mitigation methods (o1-preview, o1-mini, o1) show significantly lower performance, with o1-preview failing entirely (0%).
3. **o1-mini vs. o1**: Both post-mitigation variants underperform compared to base models, with o1-mini (40%) outperforming o1 (8%).
### Interpretation
The data suggests that:
- **Base models (GPT-4 Turbo/o)** are far more effective for this task than their post-mitigation counterparts.
- **Mitigation strategies** may have introduced constraints that severely limit task completion, particularly for o1-preview (0% success).
- The drastic drop from GPT-4o (70%) to o1-mini (40%) and o1 (8%) implies mitigation steps disproportionately affect smaller models.
- The absence of orange bars (o1-preview) in the visualization despite its 0% label indicates either a design choice to omit zero-values or a potential data inconsistency.
This chart highlights trade-offs between model capabilities and safety/mitigation measures, raising questions about the practical utility of post-mitigation systems for complex agentic tasks.