TECHNICAL ASSET FINGERPRINT
0b5ec2ba0e0f5a93a7854131
Click to view fullscreen
Press ESC or click to close
FOUND IN PAPERS
EXPERT: gemini-2.0-flash VERSION 1
RUNTIME: nugit/gemini/gemini-2.0-flash
INTEL_VERIFIED
## Bar Chart: Model Performance Comparison on Different Datasets
### Overview
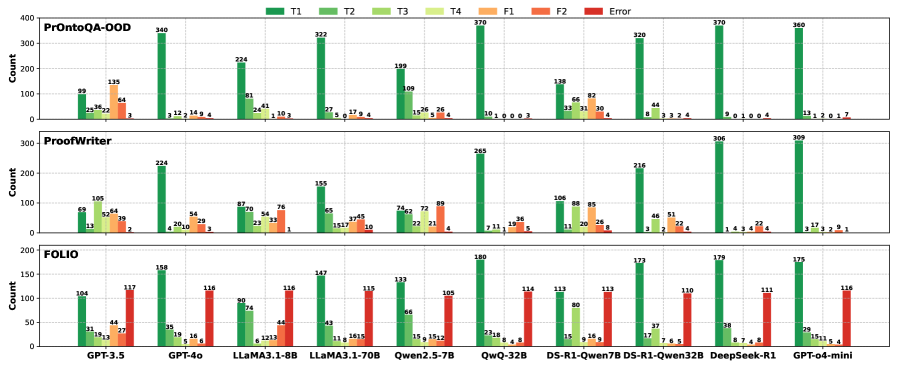
The image presents a series of bar charts comparing the performance of various language models on three different datasets: PrOntoQA-OOD, ProofWriter, and FOLIO. The charts display counts for different categories (T1, T2, T3, T4, F1, F2, and Error) for each model. The x-axis represents the different language models, and the y-axis represents the count.
### Components/Axes
* **Y-axis:** "Count", ranging from 0 to 400 for PrOntoQA-OOD, 0 to 300 for ProofWriter, and 0 to 200 for FOLIO.
* **X-axis:** Language models: GPT-3.5, GPT-4o, LLaMA3.1-8B, LLaMA3.1-70B, Qwen2.5-7B, QwQ-32B, DS-R1-Qwen7B, DS-R1-Qwen32B, DeepSeek-R1, GPT-o4-mini.
* **Datasets (Rows):** PrOntoQA-OOD (top), ProofWriter (middle), FOLIO (bottom).
* **Legend (Top):**
* T1: Dark Green
* T2: Green
* T3: Light Green
* T4: Yellow
* F1: Orange
* F2: Red
* Error: Dark Red
### Detailed Analysis
#### PrOntoQA-OOD Dataset (Top Chart)
* **GPT-3.5:**
* T1: 99
* T2: 25
* T3: 36
* T4: 22
* F1: 64
* F2: 3
* Error: 0
* **GPT-4o:**
* T1: 135
* T2: 12
* T3: 14
* T4: 9
* F1: 4
* F2: 0
* Error: 0
* **LLaMA3.1-8B:**
* T1: 224
* T2: 41
* T3: 24
* T4: 1
* F1: 10
* F2: 3
* Error: 0
* **LLaMA3.1-70B:**
* T1: 81
* T2: 27
* T3: 5
* T4: 0
* F1: 17
* F2: 9
* Error: 4
* **Qwen2.5-7B:**
* T1: 199
* T2: 16
* T3: 26
* T4: 5
* F1: 26
* F2: 4
* Error: 4
* **QwQ-32B:**
* T1: 340
* T2: 3
* T3: 12
* T4: 2
* F1: 14
* F2: 9
* Error: 4
* **DS-R1-Qwen7B:**
* T1: 370
* T2: 10
* T3: 1
* T4: 0
* F1: 0
* F2: 0
* Error: 3
* **DS-R1-Qwen32B:**
* T1: 138
* T2: 33
* T3: 31
* T4: 30
* F1: 66
* F2: 4
* Error: 0
* **DeepSeek-R1:**
* T1: 320
* T2: 44
* T3: 8
* T4: 3
* F1: 3
* F2: 2
* Error: 4
* **GPT-o4-mini:**
* T1: 370
* T2: 13
* T3: 1
* T4: 2
* F1: 0
* F2: 1
* Error: 7
#### ProofWriter Dataset (Middle Chart)
* **GPT-3.5:**
* T1: 69
* T2: 52
* T3: 13
* T4: 0
* F1: 64
* F2: 39
* Error: 2
* **GPT-4o:**
* T1: 105
* T2: 54
* T3: 20
* T4: 4
* F1: 52
* F2: 29
* Error: 3
* **LLaMA3.1-8B:**
* T1: 87
* T2: 23
* T3: 33
* T4: 1
* F1: 70
* F2: 76
* Error: 0
* **LLaMA3.1-70B:**
* T1: 70
* T2: 15
* T3: 17
* T4: 10
* F1: 65
* F2: 37
* Error: 45
* **Qwen2.5-7B:**
* T1: 155
* T2: 22
* T3: 21
* T4: 4
* F1: 74
* F2: 62
* Error: 72
* **QwQ-32B:**
* T1: 87
* T2: 7
* T3: 11
* T4: 1
* F1: 19
* F2: 36
* Error: 5
* **DS-R1-Qwen7B:**
* T1: 265
* T2: 11
* T3: 20
* T4: 26
* F1: 88
* F2: 85
* Error: 8
* **DS-R1-Qwen32B:**
* T1: 106
* T2: 3
* T3: 2
* T4: 4
* F1: 46
* F2: 51
* Error: 22
* **DeepSeek-R1:**
* T1: 216
* T2: 1
* T3: 4
* T4: 4
* F1: 22
* F2: 4
* Error: 4
* **GPT-o4-mini:**
* T1: 306
* T2: 3
* T3: 2
* T4: 9
* F1: 17
* F2: 3
* Error: 1
#### FOLIO Dataset (Bottom Chart)
* **GPT-3.5:**
* T1: 31
* T2: 19
* T3: 12
* T4: 13
* F1: 44
* F2: 27
* Error: 104
* **GPT-4o:**
* T1: 117
* T2: 35
* T3: 19
* T4: 16
* F1: 116
* F2: 6
* Error: 158
* **LLaMA3.1-8B:**
* T1: 90
* T2: 12
* T3: 12
* T4: 13
* F1: 74
* F2: 44
* Error: 116
* **LLaMA3.1-70B:**
* T1: 116
* T2: 11
* T3: 16
* T4: 15
* F1: 43
* F2: 15
* Error: 147
* **Qwen2.5-7B:**
* T1: 115
* T2: 15
* T3: 15
* T4: 12
* F1: 133
* F2: 15
* Error: 133
* **QwQ-32B:**
* T1: 114
* T2: 23
* T3: 18
* T4: 8
* F1: 105
* F2: 4
* Error: 180
* **DS-R1-Qwen7B:**
* T1: 113
* T2: 15
* T3: 16
* T4: 6
* F1: 113
* F2: 80
* Error: 114
* **DS-R1-Qwen32B:**
* T1: 173
* T2: 17
* T3: 7
* T4: 6
* F1: 37
* F2: 38
* Error: 113
* **DeepSeek-R1:**
* T1: 179
* T2: 3
* T3: 2
* T4: 9
* F1: 38
* F2: 7
* Error: 110
* **GPT-o4-mini:**
* T1: 175
* T2: 3
* T3: 2
* T4: 9
* F1: 29
* F2: 11
* Error: 116
### Key Observations
* **PrOntoQA-OOD:** DS-R1-Qwen7B and GPT-o4-mini show the highest T1 counts, indicating better performance on this dataset.
* **ProofWriter:** GPT-o4-mini and DS-R1-Qwen7B also perform well, with high T1 counts.
* **FOLIO:** DS-R1-Qwen32B and DeepSeek-R1 have the highest T1 counts, but also significant error counts.
* **Error Rates:** FOLIO generally has higher error rates across all models compared to the other two datasets.
* **Model Variation:** Performance varies significantly across different models and datasets, suggesting that some models are better suited for specific types of tasks or data.
### Interpretation
The bar charts provide a comparative analysis of various language models across three different datasets. The T1 category likely represents the most accurate or desired outcome, while T2-T4 represent varying degrees of correctness or relevance. F1 and F2 likely represent different types of failures, and "Error" represents outright incorrect responses.
The data suggests that:
* Some models (e.g., DS-R1-Qwen7B, GPT-o4-mini) excel on specific datasets like PrOntoQA-OOD and ProofWriter, indicating they might be better trained or suited for the types of questions or tasks in those datasets.
* The FOLIO dataset appears to be more challenging, as evidenced by the higher error rates across all models. This could be due to the complexity of the data, the nature of the questions, or the specific training of the models.
* There is no single "best" model across all datasets. The optimal choice depends on the specific application and the characteristics of the data.
* The distribution of T1-T4 values provides insights into the types of errors each model makes. For example, a model with a high T1 and low error rate is generally preferable to one with a high T1 but also a high error rate.
* The F1 and F2 categories could represent different types of failure modes, such as incorrect answers or irrelevant responses. Analyzing these categories can help identify specific weaknesses in each model.
DECODING INTELLIGENCE...