## Grouped Bar Chart: LLM Performance Analysis across PrOntoQA-OOD, ProofWriter, and FOLIO
### Overview
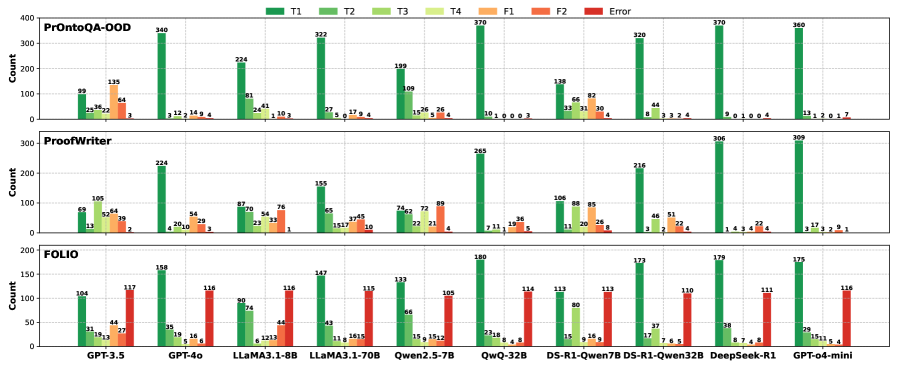
This image presents a comparative performance analysis of ten Large Language Models (LLMs) across three distinct reasoning datasets: **PrOntoQA-OOD**, **ProofWriter**, and **FOLIO**. The data is visualized as three stacked sub-charts, each sharing the same X-axis (the models) and a color-coded legend representing different performance categories (T1, T2, T3, T4, F1, F2, and Error).
### Components/Axes
* **Legend (Top):**
* **T1 (Dark Green):** Primary correct reasoning/answer category.
* **T2 (Medium Green):** Secondary correct category.
* **T3 (Light Green):** Tertiary correct category.
* **T4 (Pale Yellow/Green):** Quaternary correct category.
* **F1 (Light Orange):** Primary incorrect/false category.
* **F2 (Dark Orange):** Secondary incorrect/false category.
* **Error (Red):** Represents failure or error states.
* **X-Axis (Shared):** The models evaluated are:
* GPT-3.5, GPT-4o, LLaMA3.1-8B, LLaMA3.1-70B, Qwen2.5-7B, QwQ-32B, DS-R1-Qwen7B, DS-R1-Qwen32B, DeepSeek-R1, GPT-o4-mini.
* **Y-Axis (Count):**
* **PrOntoQA-OOD:** Scale 0 to 400.
* **ProofWriter:** Scale 0 to 300.
* **FOLIO:** Scale 0 to 200.
---
### Detailed Analysis
#### 1. PrOntoQA-OOD (Top Chart)
* **Trend:** Most models show a dominant T1 (Dark Green) bar. QwQ-32B and DeepSeek-R1 show the highest T1 counts (370).
* **Data Points (Model: T1, T2, T3, T4, F1, F2, Error):**
* **GPT-3.5:** 99, 25, 36, 22, 135, 64
* **GPT-4o:** 340, 3, 12, 2, 14, 9, 4
* **LLaMA3.1-8B:** 224, 81, 24, 41, 1, 10, 3
* **LLaMA3.1-70B:** 322, 27, 5, 0, 17, 9, 4
* **Qwen2.5-7B:** 199, 109, 15, 26, 5, 26, 4
* **QwQ-32B:** 370, 10, 1, 0, 0, 0, 3
* **DS-R1-Qwen7B:** 138, 33, 66, 31, 30, 4
* **DS-R1-Qwen32B:** 320, 8, 44, 3, 3, 2, 4
* **DeepSeek-R1:** 370, 9, 0, 1, 0, 0, 4
* **GPT-o4-mini:** 360, 13, 1, 2, 0, 1, 7
#### 2. ProofWriter (Middle Chart)
* **Trend:** T1 remains the dominant category for most, but there is a higher distribution of T3 and F2 compared to PrOntoQA-OOD.
* **Data Points (Model: T1, T2, T3, T4, F1, F2, Error):**
* **GPT-3.5:** 69, 13, 105, 52, 64, 39, 2
* **GPT-4o:** 224, 4, 20, 10, 54, 29, 3
* **LLaMA3.1-8B:** 87, 70, 23, 34, 54, 76, 1
* **LLaMA3.1-70B:** 155, 65, 15, 17, 37, 45, 10
* **Qwen2.5-7B:** 74, 62, 22, 72, 21, 89, 4
* **QwQ-32B:** 265, 7, 11, 1, 19, 36, 5
* **DS-R1-Qwen7B:** 106, 11, 88, 85, 26, 8
* **DS-R1-Qwen32B:** 216, 46, 51, 22, 4, 1
* **DeepSeek-R1:** 306, 1, 4, 3, 4, 2
* **GPT-o4-mini:** 309, 3, 17, 3, 2, 9, 1
#### 3. FOLIO (Bottom Chart)
* **Trend:** A significant, consistent "Error" (Red) bar appears for every model, ranging between 105 and 117. T1 is still the highest non-error category.
* **Data Points (Model: T1, T2, T3, T4, F1, F2, Error):**
* **GPT-3.5:** 104, 31, 19, 13, 44, 27, 117
* **GPT-4o:** 158, 35, 19, 5, 16, 6, 116
* **LLaMA3.1-8B:** 90, 74, 6, 12, 13, 44, 116
* **LLaMA3.1-70B:** 147, 43, 11, 8, 16, 15, 115
* **Qwen2.5-7B:** 133, 66, 15, 9, 15, 12, 105
* **QwQ-32B:** 180, 23, 18, 8, 4, 8, 114
* **DS-R1-Qwen7B:** 113, 80, 15, 9, 16, 9, 113
* **DS-R1-Qwen32B:** 173, 17, 37, 7, 6, 5, 110
* **DeepSeek-R1:** 179, 38, 8, 7, 4, 4, 111
* **GPT-o4-mini:** 175, 29, 15, 11, 5, 4, 116
---
### Key Observations
* **Dataset-Specific Error Rates:** The "FOLIO" dataset exhibits a massive, uniform "Error" rate across all models (approx. 110-117). This is absent in the other two datasets, suggesting a systematic issue with the FOLIO evaluation (e.g., formatting requirements, unanswerable questions, or dataset-specific constraints).
* **Model Performance:** DeepSeek-R1 and QwQ-32B consistently demonstrate the highest T1 (Dark Green) counts, indicating superior reasoning performance in PrOntoQA-OOD and ProofWriter.
* **GPT-3.5 Limitations:** GPT-3.5 consistently shows higher counts in the "False" (Orange) categories compared to newer models like GPT-4o or DeepSeek-R1, indicating lower reasoning accuracy.
### Interpretation
The data demonstrates the reasoning capabilities of various LLMs across three benchmarks. The "T1" category is clearly the target metric for success.
The most striking anomaly is the **FOLIO dataset's high error rate**. Because this error rate is consistent across all models (from GPT-3.5 to DeepSeek-R1), it is highly unlikely to be a model-specific failure. Instead, it suggests that the FOLIO dataset evaluation protocol likely contains a large subset of questions that the models are unable to process, or that the models are failing to adhere to a specific output format required by the FOLIO benchmark, resulting in a "system error" rather than a "reasoning error."
Conversely, the PrOntoQA-OOD and ProofWriter datasets show a much cleaner distribution, where models are clearly differentiated by their ability to reach the correct answer (T1) versus incorrect answers (F1/F2).