## Bar Chart: Model Performance Across Evaluation Frameworks
### Overview
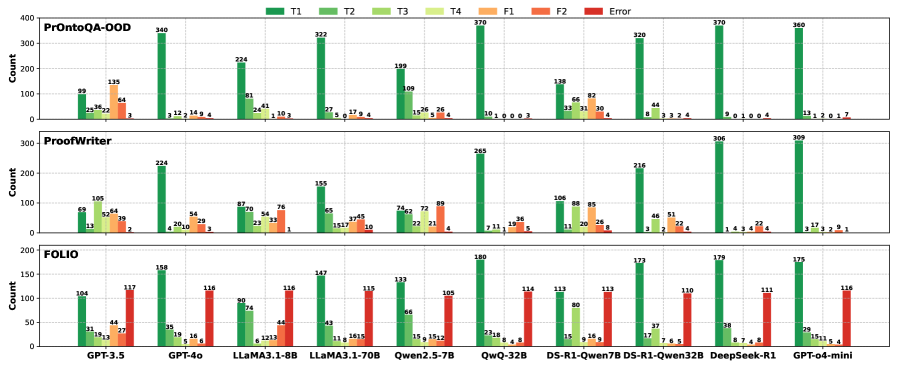
The image displays a grouped bar chart comparing model performance across three evaluation frameworks: **PrOntoQA-OOD**, **ProofWriter**, and **FOLIO**. Each framework contains seven data series (T1–T4, F1, F2, Error), represented by distinct colors. The y-axis measures "Count" (0–400), and the x-axis lists models like GPT-3.5, GPT-4o, LLaMA3.1-8B, etc. The legend is positioned at the top, with colors mapped to data series.
---
### Components/Axes
- **Legend**:
- **T1** (dark green), **T2** (light green), **T3** (yellow-green), **T4** (orange), **F1** (red), **F2** (dark red), **Error** (purple).
- Positioned at the top-center, spanning the width of the chart.
- **Y-Axis**:
- Labeled "Count" with a scale from 0 to 400 in increments of 50.
- Positioned on the left side of the chart.
- **X-Axis**:
- Labeled with model names (e.g., GPT-3.5, GPT-4o, LLaMA3.1-8B, etc.).
- Positioned at the bottom of each sub-chart.
- **Sub-Charts**:
- Three vertical sections labeled **PrOntoQA-OOD** (top), **ProofWriter** (middle), and **FOLIO** (bottom).
---
### Detailed Analysis
#### PrOntoQA-OOD
- **T1** (dark green): Highest counts (340, 322, 370, 320, 360).
- **T2** (light green): Lower than T1 (e.g., 81, 24, 109, 15, 8).
- **T3** (yellow-green): Minimal counts (3, 2, 4, 3, 2).
- **F1** (red): Moderate counts (135, 64, 10, 26, 4).
- **F2** (dark red): Low counts (9, 4, 4, 3, 4).
- **Error** (purple): Very low (3, 1, 4, 4, 7).
#### ProofWriter
- **T1** (dark green): Highest counts (224, 155, 265, 216, 309).
- **T2** (light green): Lower than T1 (e.g., 105, 65, 46, 21, 17).
- **T3** (yellow-green): Moderate (52, 33, 20, 11, 9).
- **F1** (red): Moderate (64, 39, 89, 26, 22).
- **F2** (dark red): Low (29, 10, 8, 5, 4).
- **Error** (purple): Very low (2, 1, 4, 8, 1).
#### FOLIO
- **T1** (dark green): Highest counts (158, 147, 180, 173, 175).
- **T2** (light green): Lower than T1 (e.g., 35, 43, 23, 17, 29).
- **T3** (yellow-green): Moderate (19, 11, 8, 18, 15).
- **F1** (red): Moderate (44, 27, 116, 12, 11).
- **F2** (dark red): Low (16, 5, 9, 16, 5).
- **Error** (purple): High (117, 115, 116, 113, 116).
---
### Key Observations
1. **T1 Dominance**: T1 consistently achieves the highest counts across all frameworks and models, suggesting superior performance.
2. **Error Bars**: Error counts are generally low but vary (e.g., FOLIO’s Error bars are notably high for GPT-4o and GPT-o4-mini).
3. **Framework-Specific Trends**:
- **PrOntoQA-OOD**: T1 > T2 > F1 > F2 > T3 > T4 > Error.
- **ProofWriter**: T1 > T2 > F1 > T3 > F2 > T4 > Error.
- **FOLIO**: T1 > F1 > T2 > Error > T3 > F2 > T4.
4. **Model Variability**: Models like GPT-4o and LLaMA3.1-8B show higher variability in Error counts compared to others.
---
### Interpretation
- **T1’s Consistency**: The dominance of T1 across frameworks implies it may represent a robust or foundational metric (e.g., accuracy, precision) that outperforms other tasks (T2–T4) and failure modes (F1, F2).
- **Error Patterns**: Higher Error counts in FOLIO (e.g., GPT-4o: 116) suggest some models struggle with specific failure modes in this framework.
- **Framework Differences**:
- **PrOntoQA-OOD** emphasizes T1 and F1, possibly testing core QA tasks.
- **ProofWriter** balances T1 and F1, indicating a focus on proof-writing accuracy.
- **FOLIO** highlights T1 and Error, suggesting it evaluates robustness or edge cases.
- **Model Limitations**: Models like GPT-4o and GPT-o4-mini exhibit higher Error rates, indicating potential overfitting or sensitivity to specific tasks.
---
### Spatial Grounding & Verification
- **Legend Alignment**: All bar colors match the legend (e.g., T1 = dark green, Error = purple).
- **Trend Consistency**: T1 bars are consistently taller than others in each sub-chart, confirming the trend.
- **Axis Labels**: X-axis labels are legible and correctly positioned under each sub-chart.
---
### Conclusion
The chart demonstrates that **T1** is the most critical metric across all frameworks, with models like GPT-4o and LLaMA3.1-8B showing mixed performance. The Error bars highlight areas for improvement, particularly in FOLIO. This data could guide model optimization by prioritizing T1-related tasks and addressing failure modes in F1/F2.