TECHNICAL ASSET FINGERPRINT
0b6ec1aa43fa69ca8a0e704c
Click to view fullscreen
Press ESC or click to close
FOUND IN PAPERS
EXPERT: gemini-2.0-flash VERSION 1
RUNTIME: nugit/gemini/gemini-2.0-flash
INTEL_VERIFIED
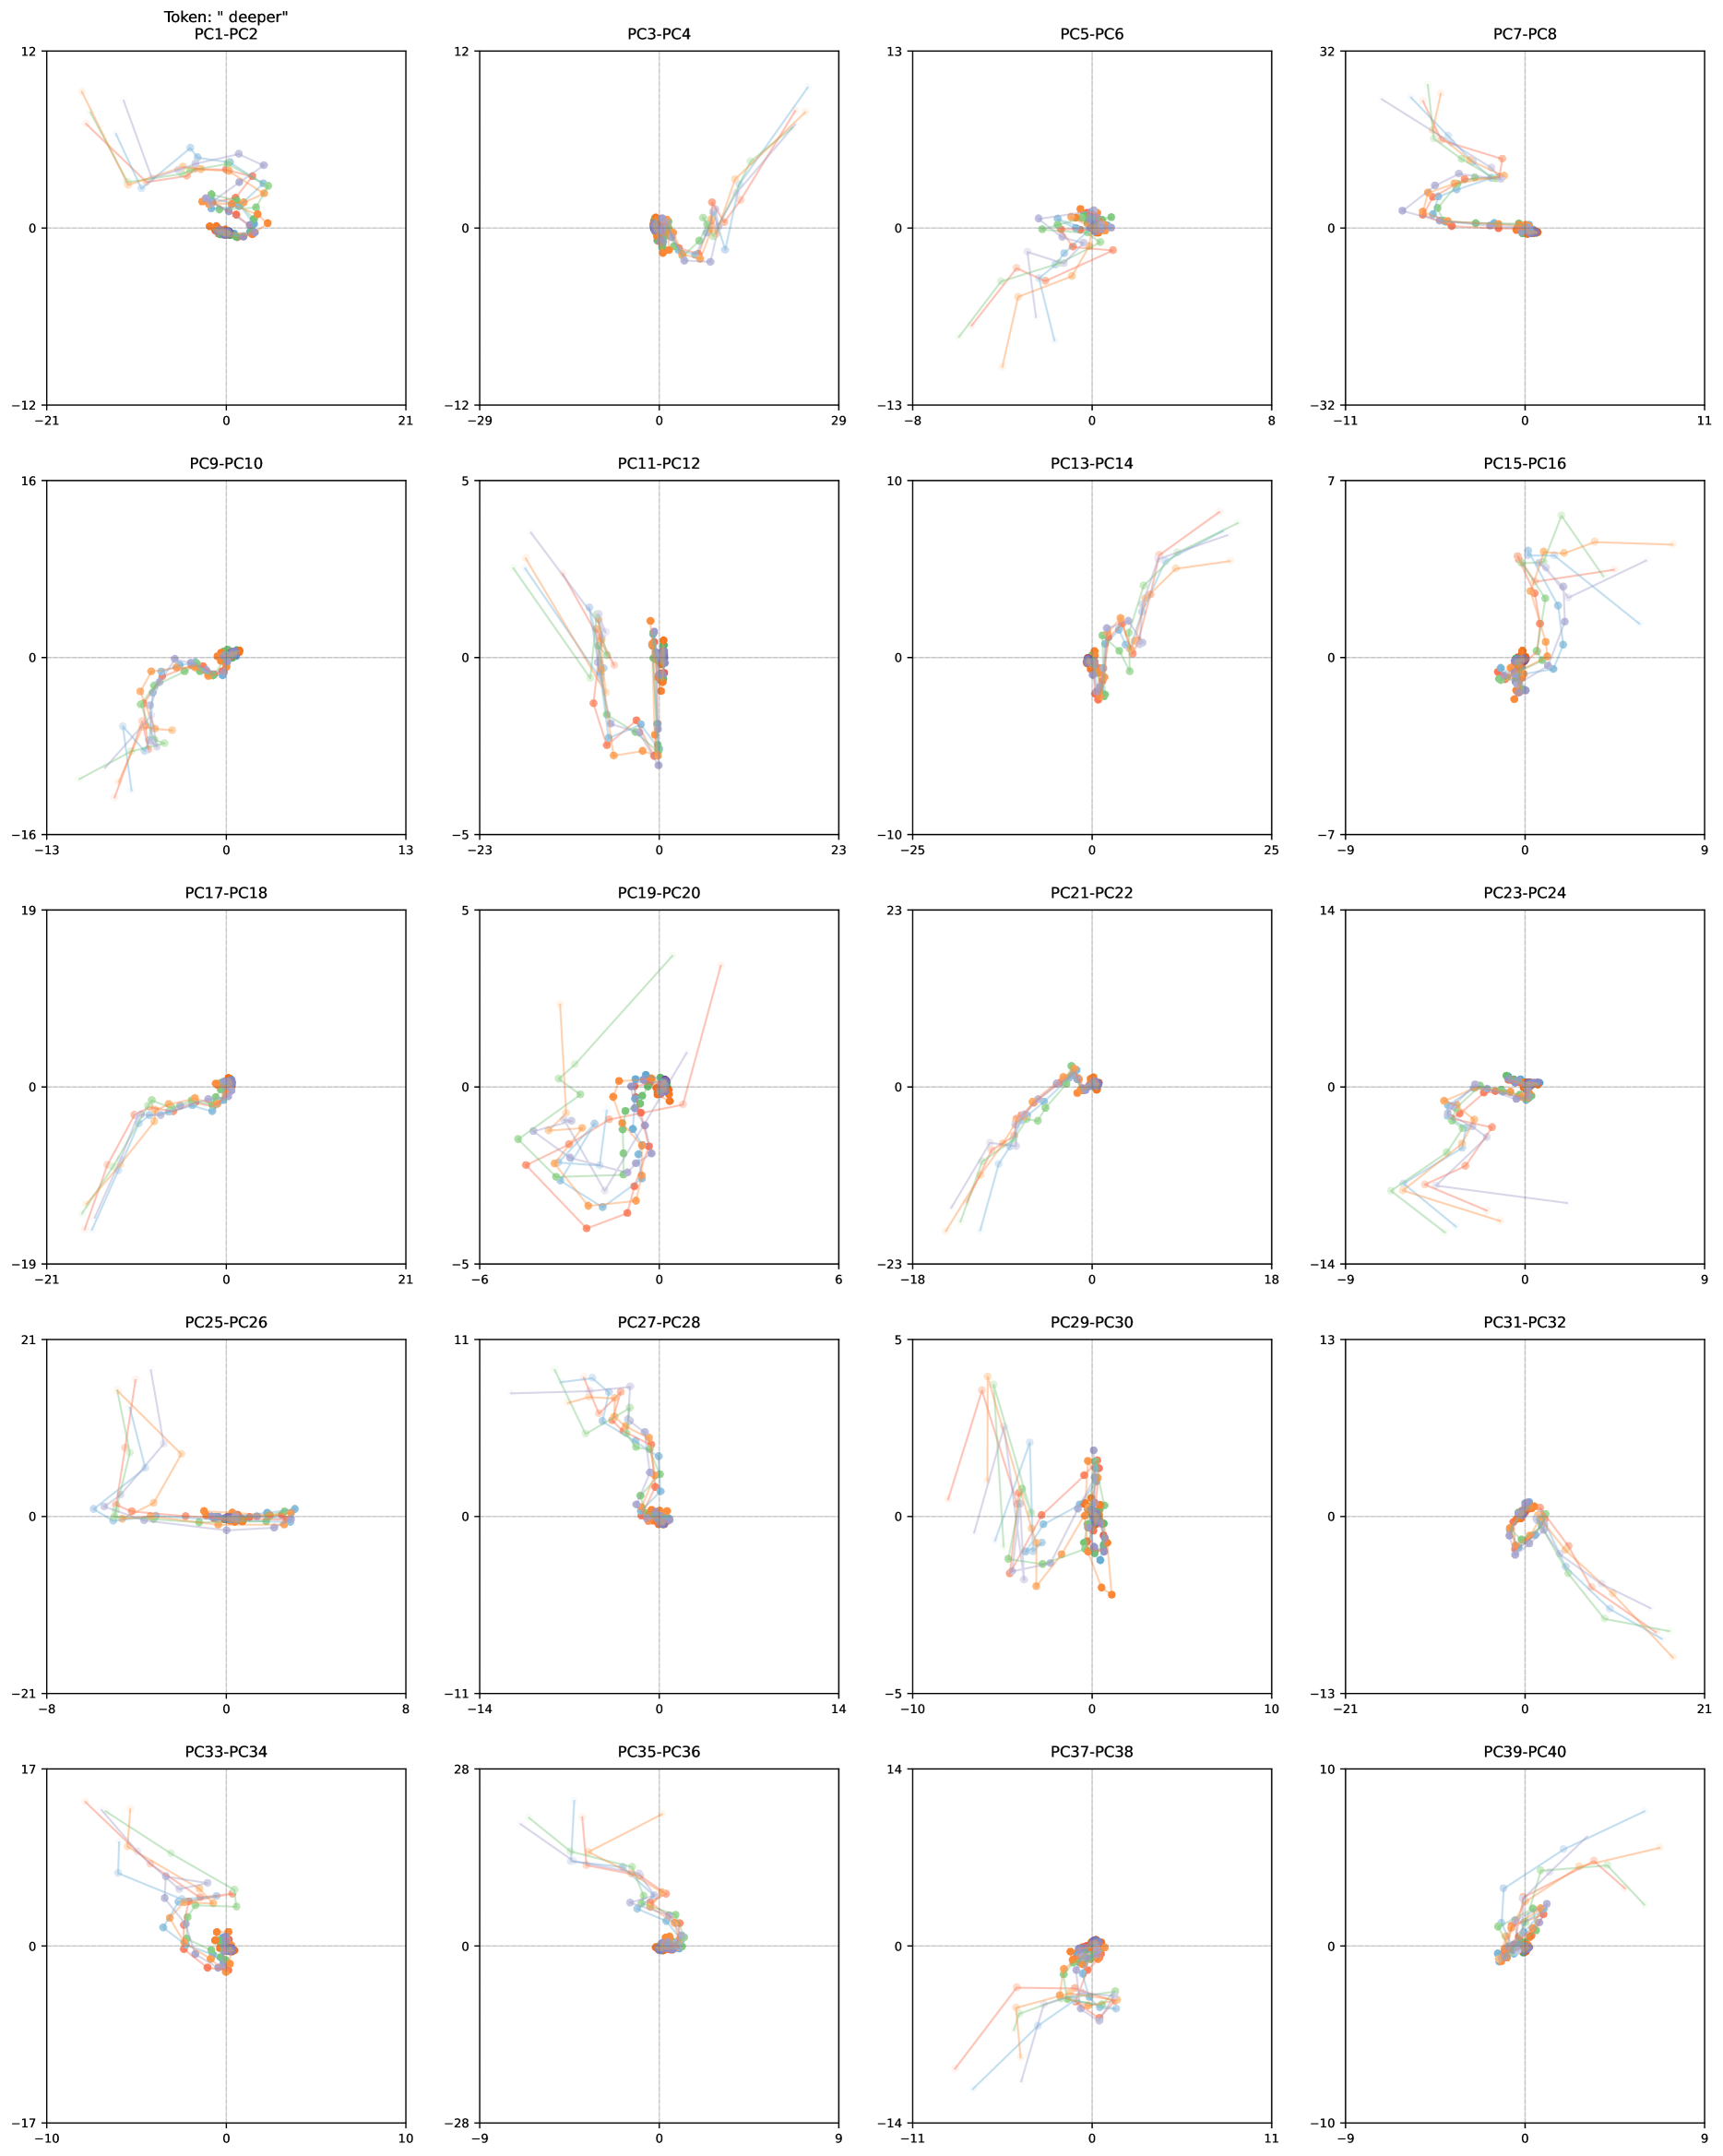
## Scatter Plot Matrix: Token "deeper" - Principal Component Analysis
### Overview
The image presents a matrix of 2D scatter plots, each representing the projection of a "deeper" token's data onto different pairs of principal components (PCs). Each plot visualizes the relationship between two PCs, with data points connected by lines. The plots are arranged in a grid, showing PC1-PC2, PC3-PC4, up to PC39-PC40. The purpose is likely to visualize the token's trajectory or behavior in a reduced-dimensional space defined by the principal components.
### Components/Axes
Each subplot represents a 2D scatter plot.
* **Title:** Each plot is titled with the corresponding PC pair (e.g., "PC1-PC2", "PC3-PC4", etc.). The overall title is "Token: " deeper"".
* **Axes:** Each plot has an x-axis and a y-axis, representing the two principal components in the title.
* **Axis Scales:** The scales vary between plots. Examples:
* PC1-PC2: x-axis ranges from -21 to 21, y-axis ranges from -12 to 12.
* PC3-PC4: x-axis ranges from -29 to 29, y-axis ranges from -12 to 12.
* PC5-PC6: x-axis ranges from -8 to 8, y-axis ranges from -13 to 13.
* PC7-PC8: x-axis ranges from -11 to 11, y-axis ranges from -32 to 32.
* PC9-PC10: x-axis ranges from -13 to 13, y-axis ranges from -16 to 16.
* PC11-PC12: x-axis ranges from -23 to 23, y-axis ranges from -5 to 5.
* PC13-PC14: x-axis ranges from -25 to 25, y-axis ranges from -10 to 10.
* PC15-PC16: x-axis ranges from -9 to 9, y-axis ranges from -7 to 7.
* PC17-PC18: x-axis ranges from -21 to 21, y-axis ranges from -19 to 19.
* PC19-PC20: x-axis ranges from -6 to 6, y-axis ranges from -5 to 5.
* PC21-PC22: x-axis ranges from -18 to 18, y-axis ranges from -23 to 23.
* PC23-PC24: x-axis ranges from -9 to 9, y-axis ranges from -14 to 14.
* PC25-PC26: x-axis ranges from -8 to 8, y-axis ranges from -21 to 21.
* PC27-PC28: x-axis ranges from -11 to 11, y-axis ranges from -11 to 11.
* PC29-PC30: x-axis ranges from -9 to 9, y-axis ranges from -5 to 5.
* PC31-PC32: x-axis ranges from -21 to 21, y-axis ranges from -13 to 13.
* PC33-PC34: x-axis ranges from -10 to 10, y-axis ranges from -17 to 17.
* PC35-PC36: x-axis ranges from -9 to 9, y-axis ranges from -28 to 28.
* PC37-PC38: x-axis ranges from -11 to 11, y-axis ranges from -14 to 14.
* PC39-PC40: x-axis ranges from -9 to 9, y-axis ranges from -10 to 10.
* **Data Points:** Each plot contains multiple data points connected by lines. The data points are clustered, and the lines show the trajectory. The points are colored, but there is no explicit legend. The colors appear to be orange, green, light blue, and purple.
### Detailed Analysis or ### Content Details
* **PC1-PC2:** The data points form a spiral-like pattern, starting from the top-left and moving towards the center.
* **PC3-PC4:** The data points generally move from the bottom-left to the top-right.
* **PC5-PC6:** The data points are clustered around the center, with some trajectories extending outwards.
* **PC7-PC8:** The data points form a complex, winding path, starting from the center and moving outwards before looping back.
* **PC9-PC10:** The data points form a curved path, starting from the bottom-left and moving towards the center.
* **PC11-PC12:** The data points are scattered, with trajectories extending from the center towards the bottom-left and top-left.
* **PC13-PC14:** The data points generally move from the bottom-left to the top-right.
* **PC15-PC16:** The data points are clustered around the center, with some trajectories extending outwards.
* **PC17-PC18:** The data points form a curved path, starting from the bottom-left and moving towards the center.
* **PC19-PC20:** The data points are clustered around the center, with some trajectories extending outwards.
* **PC21-PC22:** The data points are clustered around the center, with some trajectories extending outwards.
* **PC23-PC24:** The data points are clustered around the center, with some trajectories extending outwards.
* **PC25-PC26:** The data points are clustered around the center, with some trajectories extending outwards.
* **PC27-PC28:** The data points are clustered around the center, with some trajectories extending outwards.
* **PC29-PC30:** The data points are clustered around the center, with some trajectories extending outwards.
* **PC31-PC32:** The data points are clustered around the center, with some trajectories extending outwards.
* **PC33-PC34:** The data points are clustered around the center, with some trajectories extending outwards.
* **PC35-PC36:** The data points are clustered around the center, with some trajectories extending outwards.
* **PC37-PC38:** The data points are clustered around the center, with some trajectories extending outwards.
* **PC39-PC40:** The data points are clustered around the center, with some trajectories extending outwards.
### Key Observations
* The plots show the projection of the token's data onto different pairs of principal components.
* The trajectories vary significantly between different PC pairs, indicating that the token's behavior is complex and multi-dimensional.
* Many plots show a clustering of data points around the center, suggesting that the token spends a significant amount of time in a particular state or configuration.
* The lines connecting the data points show the trajectory of the token over time.
### Interpretation
The scatter plot matrix visualizes the behavior of a "deeper" token in a reduced-dimensional space defined by principal components. The different plots reveal how the token's state changes over time with respect to different combinations of principal components. The clustering of data points suggests stable states, while the trajectories indicate transitions between these states. The varying patterns across different PC pairs highlight the complexity of the token's behavior, suggesting that it is influenced by multiple underlying factors captured by the principal components. Without a legend, it's difficult to determine what each color represents, but it's likely different runs or conditions. The analysis suggests that PCA is used to reduce the dimensionality of the token's state space, allowing for visualization and analysis of its behavior in terms of its most significant modes of variation.
DECODING INTELLIGENCE...