\n
## Scatter Plot Matrix: Principal Component Analysis (PCA)
### Overview
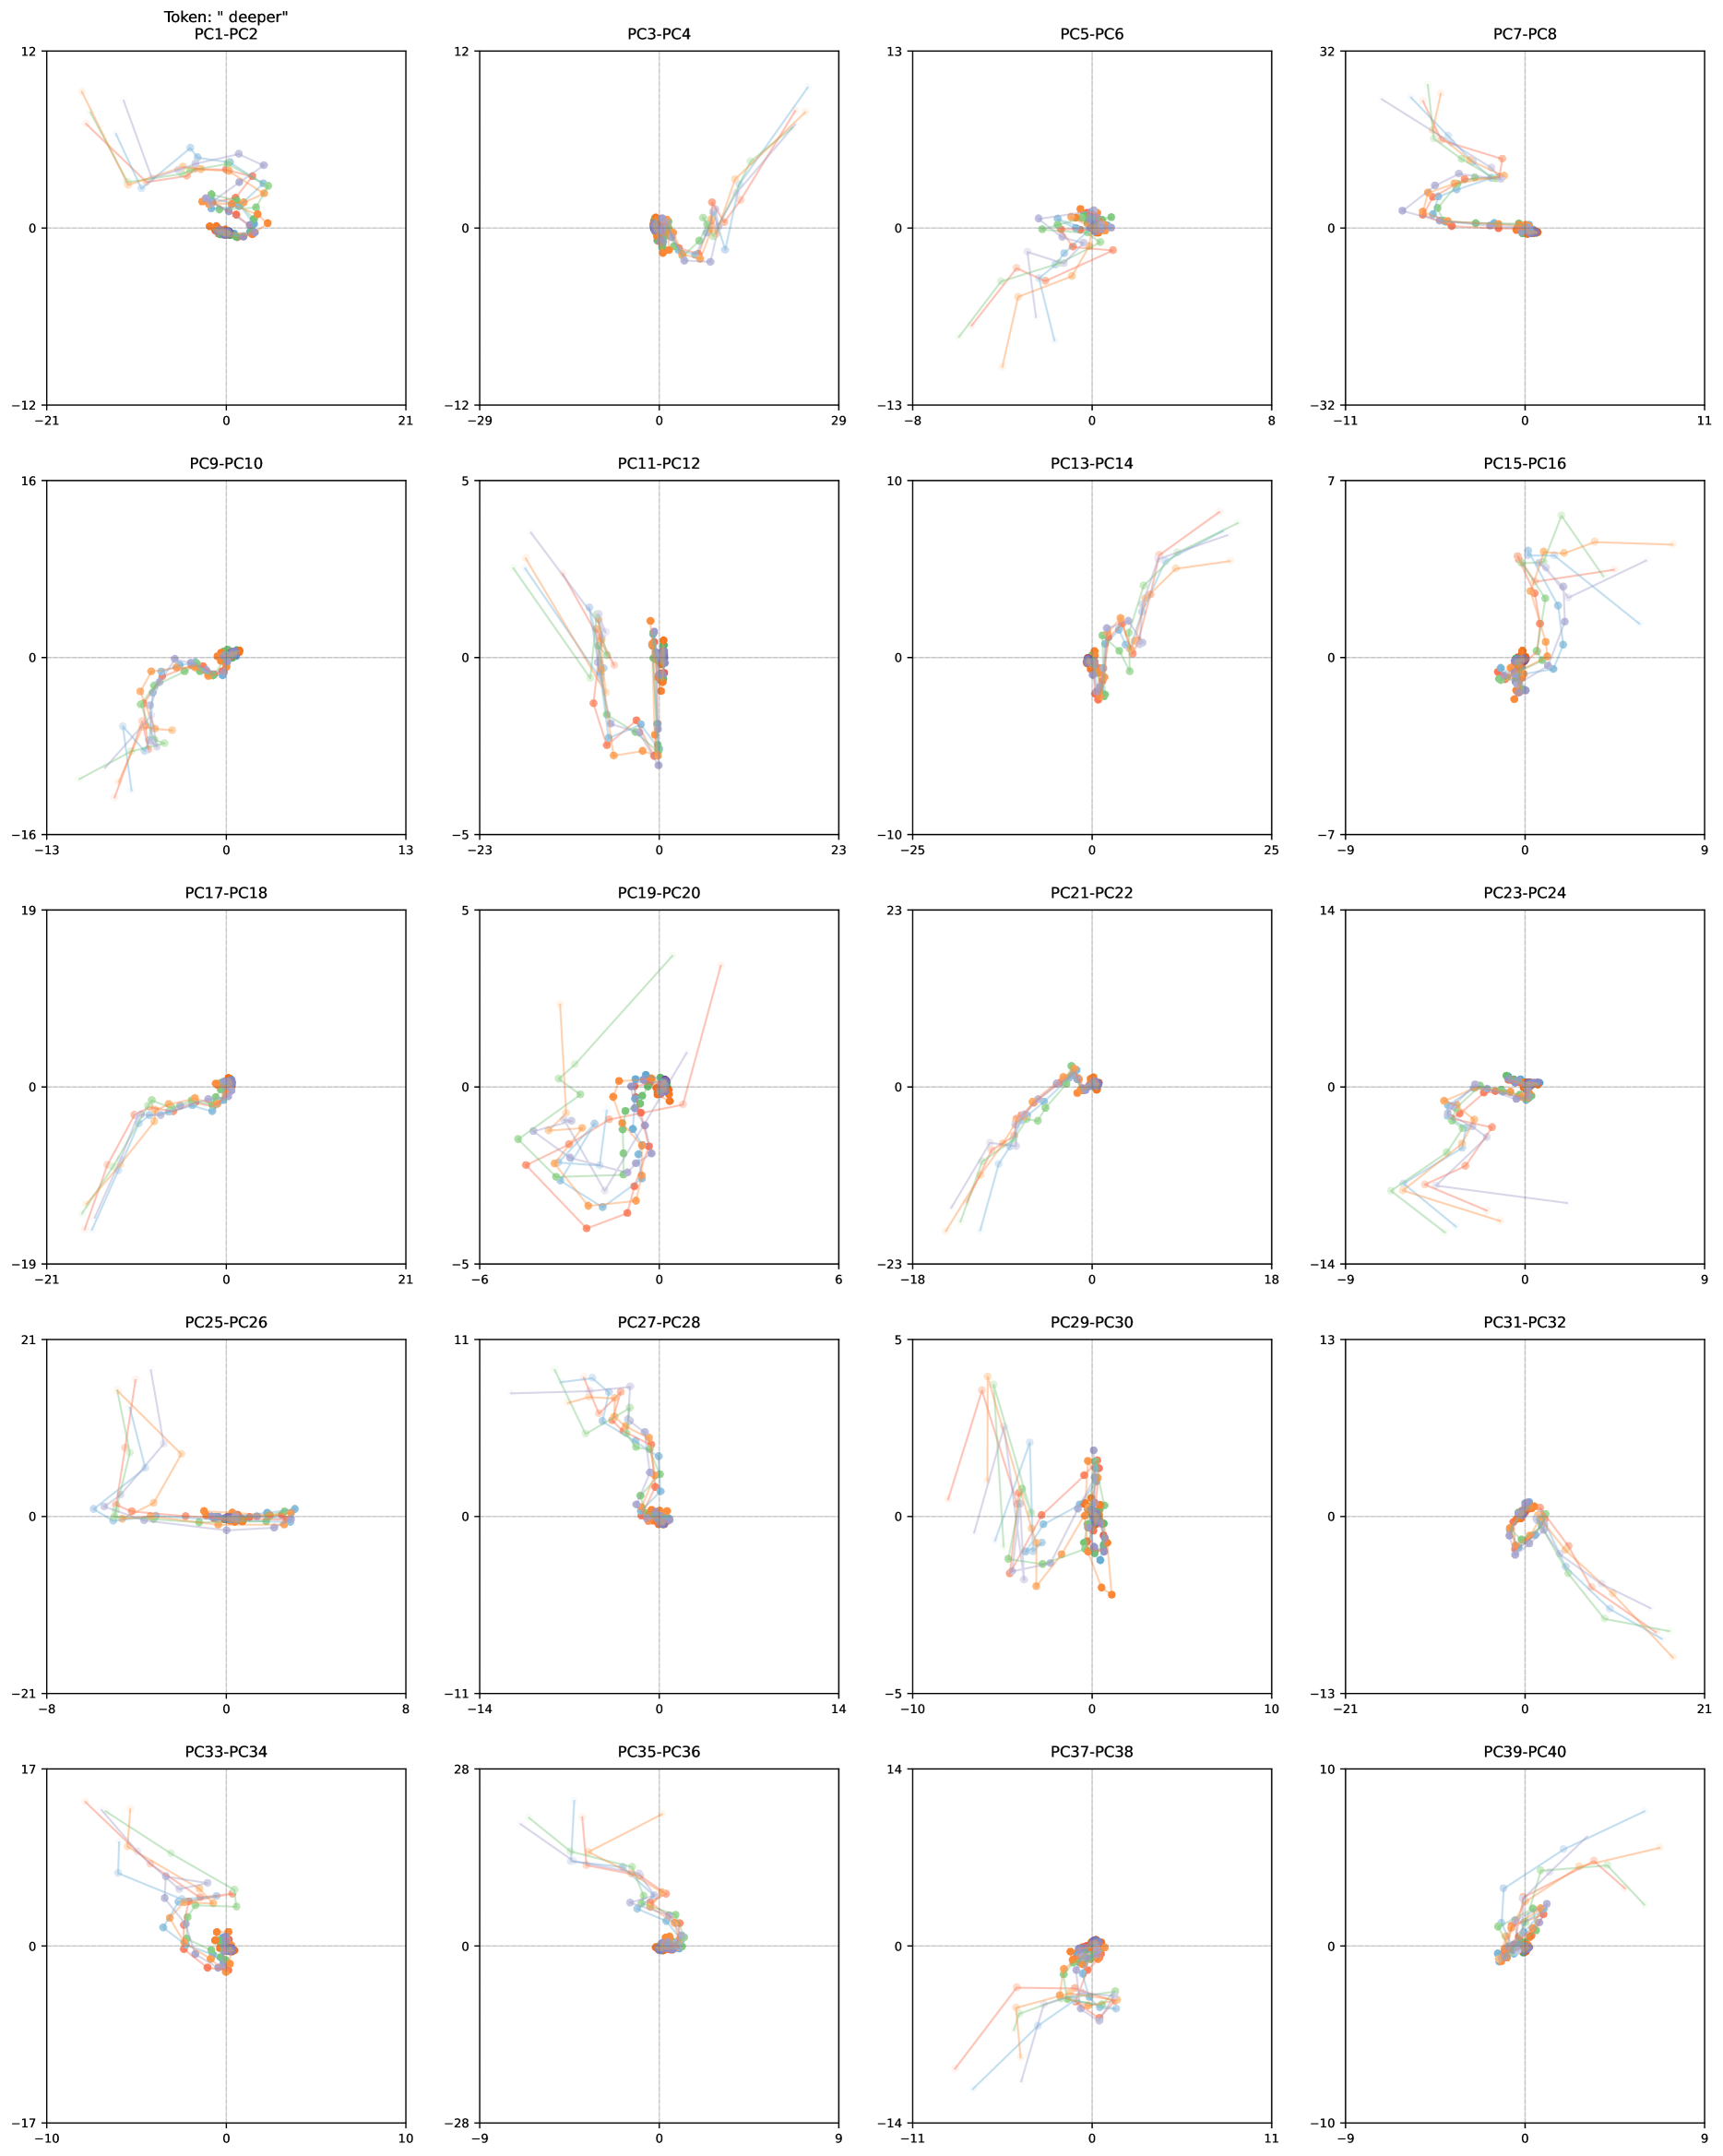
The image presents a scatter plot matrix visualizing the results of a Principal Component Analysis (PCA). It displays pairwise relationships between 20 principal components (PC1 through PC40). Each subplot represents a scatter plot of two principal components, with data points colored to represent different clusters or categories. The plots aim to reveal patterns and correlations within the data as projected onto these principal components.
### Components/Axes
The image consists of a 5x4 grid of scatter plots. Each plot has two axes, labeled "PC[number]" (e.g., PC1, PC2, PC3, etc.). The axes scales vary for each plot, ranging approximately from -32 to 32, -29 to 21, -23 to 25, -19 to 21, -18 to 14, and so on. A "Token: 'deeper'" label is present at the top-left corner of the image. There is no explicit legend, but the color of the data points in each plot appears to represent different categories.
### Detailed Analysis or Content Details
Due to the complexity of the matrix and the varying scales, precise numerical values are difficult to extract. However, the following observations can be made for each subplot:
* **PC1-PC2:** Data points are clustered in the top-left quadrant, with some points extending towards the bottom-right.
* **PC3-PC4:** Points are scattered across the plot, with a concentration in the top-right quadrant.
* **PC5-PC6:** Points are distributed along a diagonal line from the top-left to the bottom-right.
* **PC7-PC8:** Points are clustered in the top-left quadrant, with a few outliers extending towards the bottom-right.
* **PC9-PC10:** Points are scattered, with a concentration in the bottom-left quadrant.
* **PC11-PC12:** Points are distributed along a diagonal line from the top-right to the bottom-left.
* **PC13-PC14:** Points are scattered, with a concentration in the bottom-right quadrant.
* **PC15-PC16:** Points are clustered in the top-right quadrant.
* **PC17-PC18:** Points are scattered, with a concentration in the bottom-left quadrant.
* **PC19-PC20:** Points are scattered, with a concentration in the bottom-right quadrant.
* **PC21-PC22:** Points are scattered, with a concentration in the bottom-left quadrant.
* **PC23-PC24:** Points are clustered in the top-right quadrant.
* **PC25-PC26:** Points are scattered, with a concentration in the bottom-left quadrant.
* **PC27-PC28:** Points are scattered, with a concentration in the top-right quadrant.
* **PC29-PC30:** Points are scattered, with a concentration in the bottom-right quadrant.
* **PC31-PC32:** Points are clustered in the top-right quadrant.
* **PC33-PC34:** Points are scattered, with a concentration in the bottom-left quadrant.
* **PC35-PC36:** Points are scattered, with a concentration in the bottom-right quadrant.
* **PC37-PC38:** Points are scattered, with a concentration in the top-right quadrant.
* **PC39-PC40:** Points are scattered, with a concentration in the bottom-left quadrant.
Each plot uses a different color scheme for the data points. The colors appear to be consistent within each plot, but vary across the matrix. The colors include shades of blue, green, red, and orange.
### Key Observations
* The distribution of points varies significantly across different PC pairs.
* Some PC pairs show clear clustering, while others exhibit more scattered distributions.
* Diagonal patterns are observed in some plots (e.g., PC5-PC6, PC11-PC12), suggesting a strong positive correlation between the corresponding principal components.
* The "Token: 'deeper'" label suggests that this PCA might be related to a specific token or feature in the original dataset.
### Interpretation
This PCA scatter plot matrix provides a visual representation of the data's variance across the first 40 principal components. Each plot reveals how the data is distributed when projected onto two different components. The varying distributions and correlations suggest that different principal components capture different aspects of the data's underlying structure.
The presence of clustering in some plots indicates that the corresponding principal components effectively separate different groups or categories within the data. The diagonal patterns suggest strong correlations between certain components, meaning they capture similar information.
The "Token: 'deeper'" label implies that the PCA is being applied to data related to this token, potentially to understand its characteristics or relationships with other features. The matrix allows for the identification of the principal components that are most informative for distinguishing or representing this token.
Without knowing the original data and the meaning of the "deeper" token, it's difficult to provide a more specific interpretation. However, the PCA matrix provides a valuable tool for exploring the data's structure and identifying key patterns and relationships. Further analysis, such as examining the loadings of each principal component, would be necessary to fully understand the meaning of these results.