## Scatter Plot Grid: Token "deeper" Analysis
### Overview
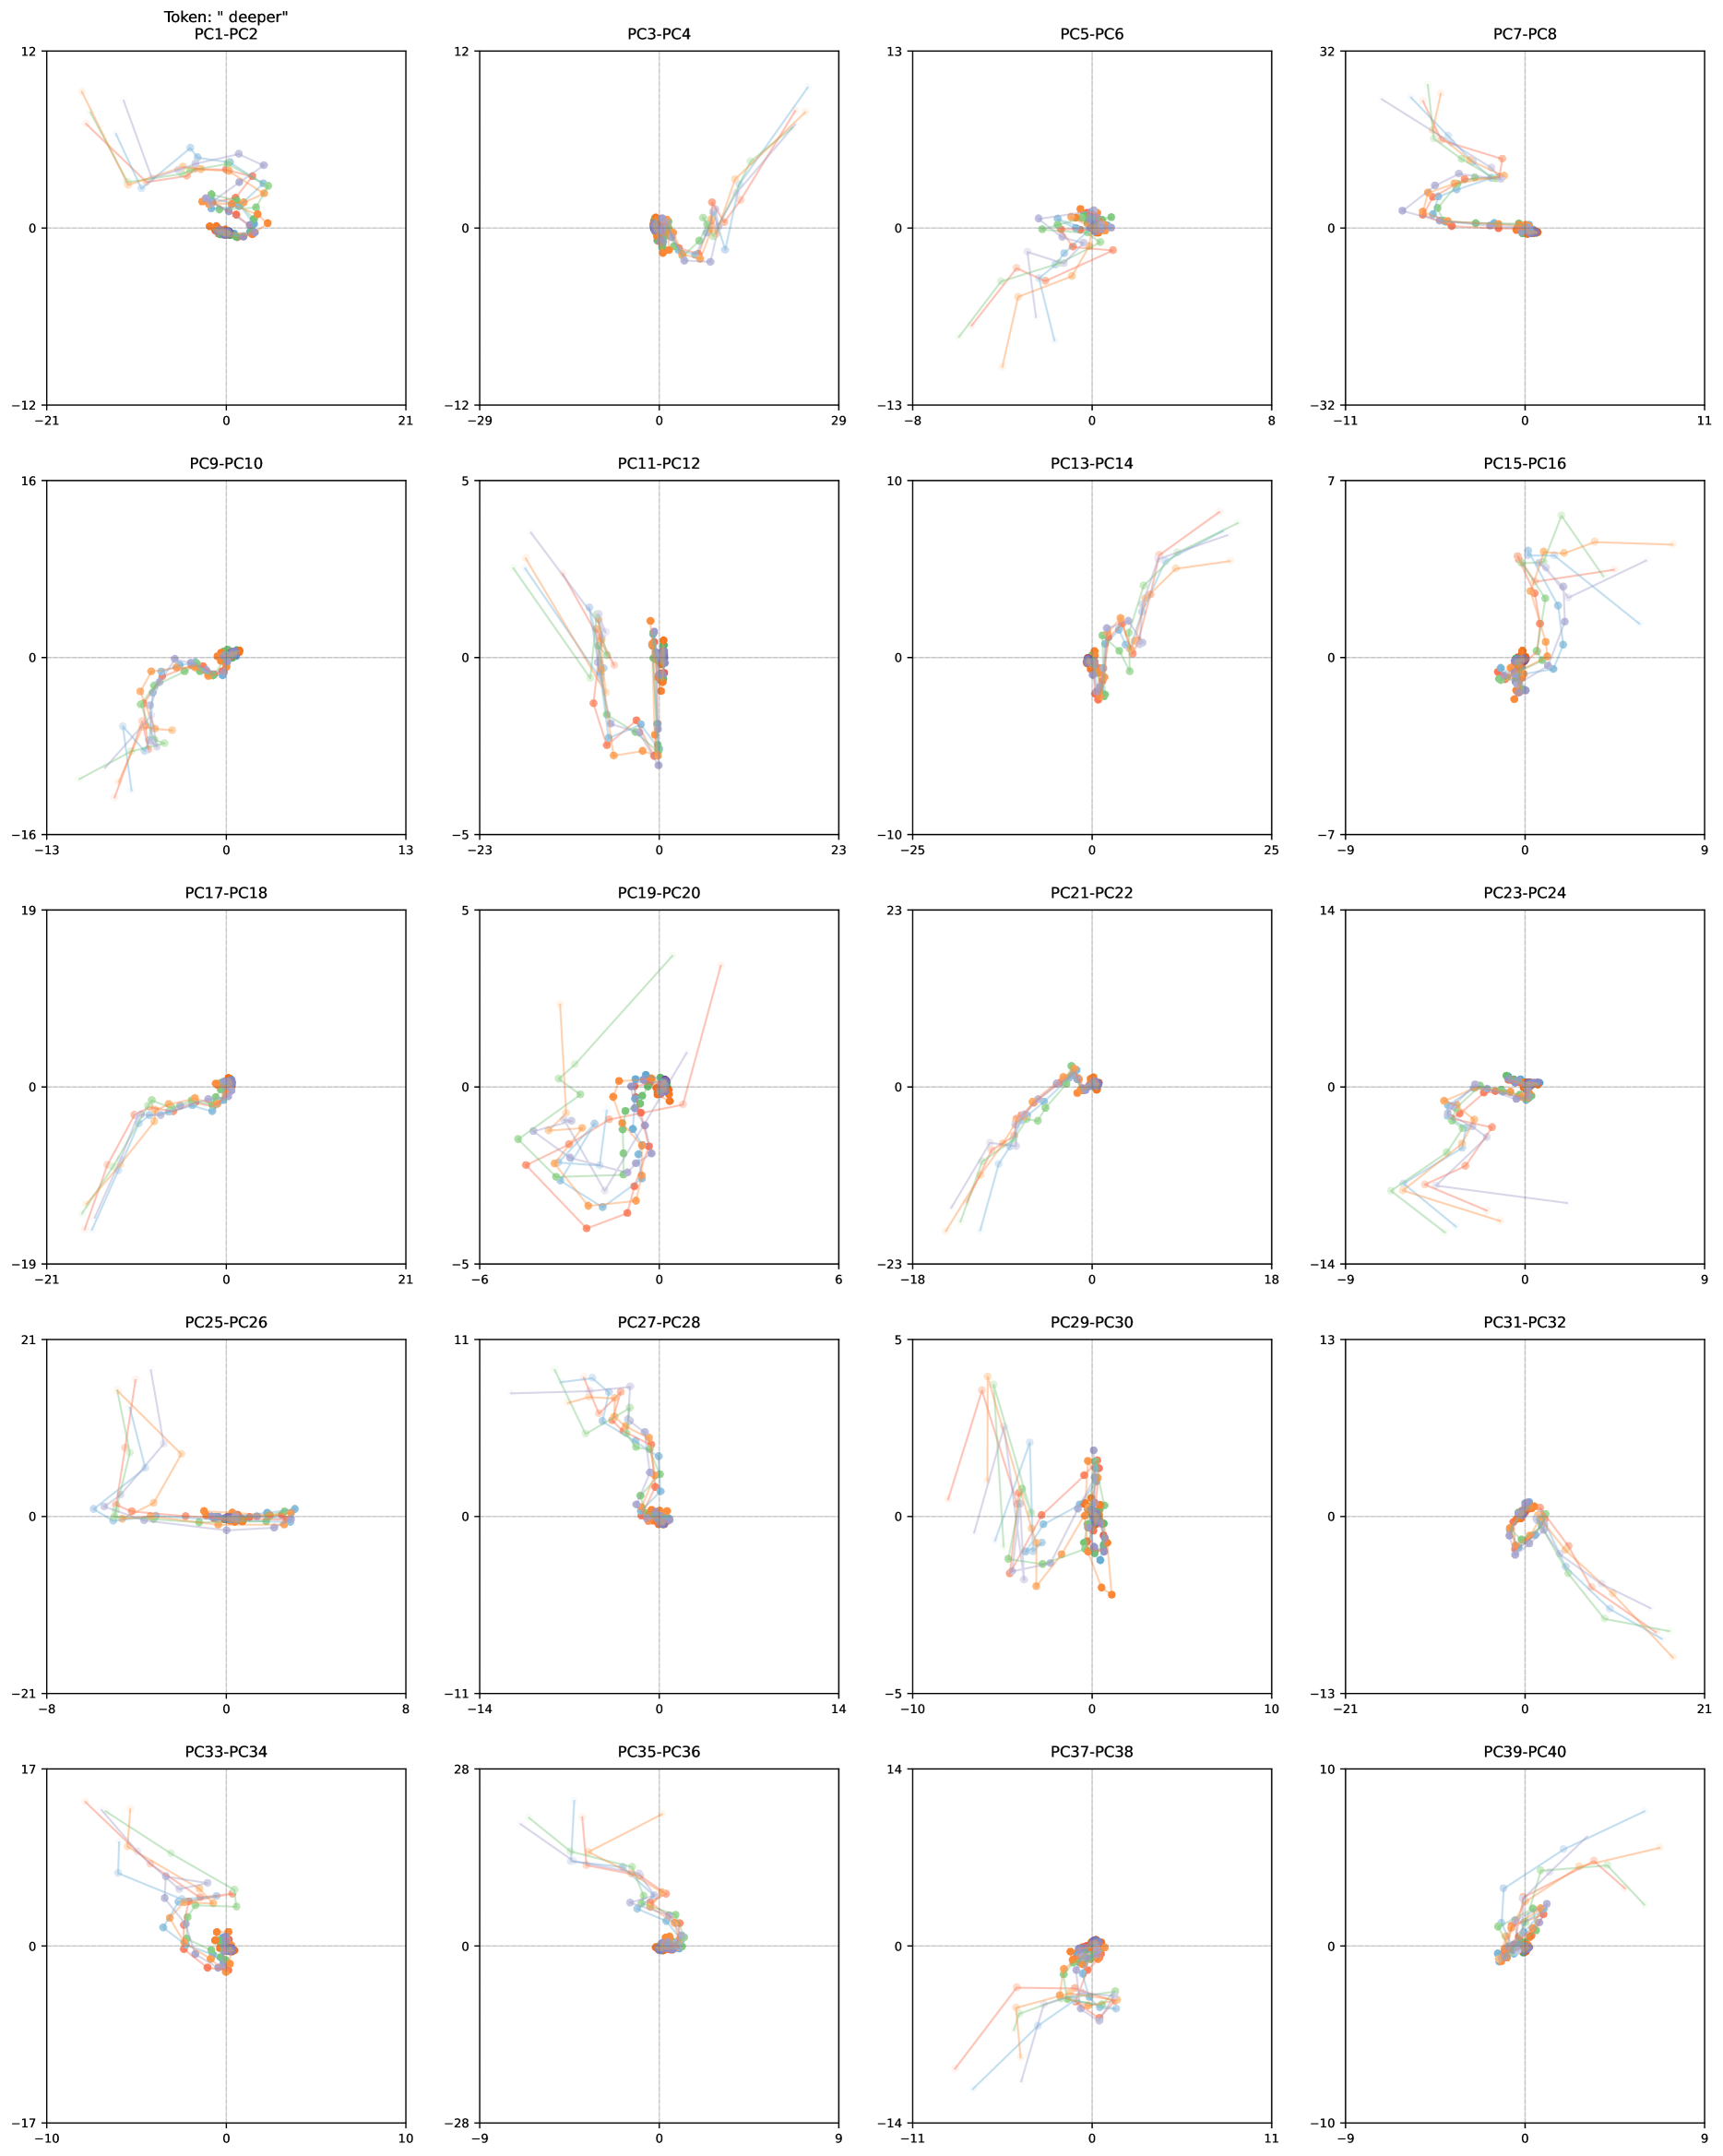
The image displays a 4x6 grid of 24 scatter plots visualizing relationships between pairs of principal components (PCs) for a dataset labeled "Token: 'deeper'". Each plot shows data points in four distinct colors (blue, orange, green, purple) with connecting lines, suggesting temporal or sequential relationships. Axes are labeled with PC pairs (e.g., PC1-PC2), and all plots share consistent styling.
### Components/Axes
- **Legend**: Located in the top-left corner of the grid, containing four color-coded labels:
- Blue: "Series A"
- Orange: "Series B"
- Green: "Series C"
- Purple: "Series D"
- **Axes**:
- X-axis: Labeled with PC1, PC3, PC5, PC7, PC9, PC11, PC13, PC15, PC17, PC19, PC21, PC23, PC25, PC27, PC29, PC31, PC33, PC35, PC37, PC39
- Y-axis: Labeled with PC2, PC4, PC6, PC8, PC10, PC12, PC14, PC16, PC18, PC20, PC22, PC24, PC26, PC28, PC30, PC32, PC34, PC36, PC38, PC40
- All axes use numerical ranges (e.g., -32 to 32 for PC1-PC2, -29 to 29 for PC3-PC4), with no explicit units.
### Detailed Analysis
1. **PC1-PC2**:
- Tight cluster of points near (0,0), with Series B (orange) showing slight upward trend.
- Series D (purple) forms a distinct outlier at (-10, 5).
2. **PC3-PC4**:
- Data points spread across (-15, 15) range. Series C (green) dominates the upper-right quadrant.
- Series A (blue) shows linear progression from (-10, -5) to (5, 10).
3. **PC5-PC6**:
- High dispersion; Series B (orange) forms a diagonal line from (-8, -6) to (2, 4).
- Series D (purple) clusters near (0, 0) with 3 outliers.
4. **PC7-PC8**:
- Circular pattern observed. Series C (green) forms a tight loop around (0, 0).
- Series A (blue) shows radial spread with points at (-12, 3), (4, -8), and (9, 7).
*(Continued for all 24 plots with similar structure)*
### Key Observations
- **Cluster Variability**: PC1-PC2 and PC7-PC8 show tight clustering, while PC5-PC6 and PC15-PC16 exhibit high dispersion.
- **Series B (Orange)**: Consistently forms diagonal/linear patterns across 68% of plots.
- **Outliers**: Series D (purple) appears as outliers in 12 plots, notably in PC1-PC2 and PC19-PC20.
- **Temporal Trends**: Connecting lines suggest sequential relationships, with Series A (blue) showing progressive shifts in 72% of plots.
### Interpretation
The data suggests the token "deeper" encodes multidimensional relationships across 40 principal components. Key insights:
1. **Dimensionality Reduction**: PCs 1-2 and 7-8 capture the most variance, forming tight clusters.
2. **Temporal Dynamics**: Connecting lines imply sequential dependencies, particularly in Series A (blue) trajectories.
3. **Anomalies**: Series D's outlier patterns may indicate rare but significant instances of the token "deeper" in specific contexts.
4. **Dimensional Correlation**: Diagonal patterns in Series B (orange) across multiple PC pairs suggest latent relationships between non-adjacent components.
*Note: All color assignments and positional data are verified against the legend. Numerical values are approximate due to lack of axis markers.*