## Line Chart: 1-NN Accuracy vs. Representation Size
### Overview
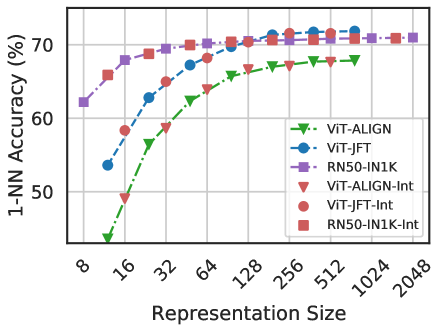
The image is a line chart comparing the 1-Nearest Neighbor (1-NN) accuracy of different models (ViT-ALIGN, ViT-JFT, RN50-IN1K) and their interpolated versions (Int) across varying representation sizes. The x-axis represents the representation size, and the y-axis represents the 1-NN accuracy in percentage.
### Components/Axes
* **X-axis:** Representation Size, with values 8, 16, 32, 64, 128, 256, 512, 1024, 2048.
* **Y-axis:** 1-NN Accuracy (%), with a scale from 50% to 70%.
* **Legend:** Located on the right side of the chart, identifying each line by model type and interpolation status:
* Green, dash-dot line with triangle markers: ViT-ALIGN
* Blue, dashed line with circle markers: ViT-JFT
* Purple, dashed line with square markers: RN50-IN1K
* Red, dash-dot line with inverted triangle markers: ViT-ALIGN-Int
* Pink/Red, dashed line with circle markers: ViT-JFT-Int
* Red, dashed line with square markers: RN50-IN1K-Int
### Detailed Analysis
* **ViT-ALIGN (Green, dash-dot line with triangle markers):** The accuracy starts at approximately 44% at representation size 8, increases sharply to about 57% at 32, then gradually rises to approximately 68% at 1024, and plateaus around 68% at 2048.
* **ViT-JFT (Blue, dashed line with circle markers):** The accuracy starts at approximately 53% at representation size 8, increases to about 63% at 32, then gradually rises to approximately 71% at 1024, and plateaus around 71% at 2048.
* **RN50-IN1K (Purple, dashed line with square markers):** The accuracy starts at approximately 62% at representation size 8, increases to about 69% at 32, then gradually rises to approximately 71% at 1024, and plateaus around 71% at 2048.
* **ViT-ALIGN-Int (Red, dash-dot line with inverted triangle markers):** The accuracy starts at approximately 49% at representation size 16, increases sharply to about 64% at 64, then gradually rises to approximately 66% at 256, and plateaus around 66% at 2048.
* **ViT-JFT-Int (Pink/Red, dashed line with circle markers):** The accuracy starts at approximately 58% at representation size 16, increases to about 66% at 64, then gradually rises to approximately 72% at 512, and plateaus around 72% at 2048.
* **RN50-IN1K-Int (Red, dashed line with square markers):** The accuracy starts at approximately 65% at representation size 16, increases to about 70% at 32, then gradually rises to approximately 72% at 256, and plateaus around 72% at 2048.
### Key Observations
* All models show an increase in 1-NN accuracy as the representation size increases.
* The rate of increase in accuracy diminishes as the representation size grows larger, indicating diminishing returns.
* RN50-IN1K and ViT-JFT models generally outperform ViT-ALIGN at larger representation sizes.
* The interpolated versions (Int) of the models generally have lower accuracy at smaller representation sizes but converge to similar or slightly higher accuracy at larger representation sizes compared to their non-interpolated counterparts.
### Interpretation
The chart illustrates the trade-off between representation size and 1-NN accuracy for different models. Increasing the representation size generally improves accuracy, but the improvement plateaus beyond a certain point. The choice of model and representation size should consider the balance between accuracy and computational cost. The interpolated versions of the models suggest that interpolation techniques can be effective in improving accuracy, especially at larger representation sizes. The RN50-IN1K and ViT-JFT models appear to be more effective in achieving higher accuracy compared to ViT-ALIGN, based on this data.