TECHNICAL ASSET FINGERPRINT
0b6f40413affb995e89b03ad
Click to view fullscreen
Press ESC or click to close
FOUND IN PAPERS
EXPERT: healer-alpha-free VERSION 1
RUNTIME: free/openrouter/healer-alpha
INTEL_VERIFIED
\n
## Line Chart: 1-NN Accuracy vs. Representation Size for Various Models
### Overview
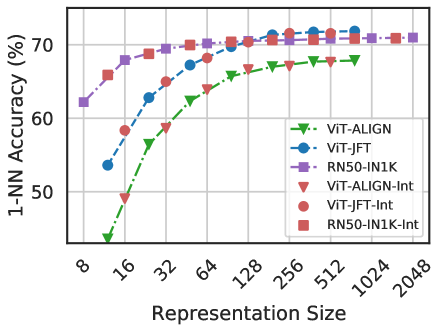
The image is a line chart plotting the 1-Nearest Neighbor (1-NN) classification accuracy (in percentage) against the representation size (dimensionality) for six different model configurations. The chart compares the performance scaling of three base models (ViT-ALIGN, ViT-JFT, RN50-IN1K) and their corresponding "-Int" (likely "Interpolated" or "Integrated") variants.
### Components/Axes
* **Y-Axis (Vertical):** Labeled **"1-NN Accuracy (%)"**. The scale runs from approximately 45% to 75%, with major gridlines at 50%, 60%, and 70%.
* **X-Axis (Horizontal):** Labeled **"Representation Size"**. The scale is logarithmic (base 2), with labeled tick marks at 8, 16, 32, 64, 128, 256, 512, 1024, and 2048.
* **Legend:** Positioned in the **bottom-right corner** of the chart area. It contains six entries, each with a unique color and marker symbol:
1. **ViT-ALIGN:** Green dashed line with downward-pointing triangle markers (▼).
2. **ViT-JFT:** Blue dashed line with circle markers (●).
3. **RN50-IN1K:** Purple dashed line with square markers (■).
4. **ViT-ALIGN-Int:** Red dotted line with downward-pointing triangle markers (▼).
5. **ViT-JFT-Int:** Red dotted line with circle markers (●).
6. **RN50-IN1K-Int:** Red dotted line with square markers (■).
### Detailed Analysis
The chart shows six data series, each representing a model's accuracy as its representation size increases.
**1. ViT-ALIGN (Green, ▼, Dashed):**
* **Trend:** Starts as the lowest-performing model at small sizes but shows a strong, steady upward slope, indicating significant improvement with scaling.
* **Data Points (Approximate):**
* Size 8: ~45%
* Size 16: ~50%
* Size 32: ~59%
* Size 64: ~64%
* Size 128: ~67%
* Size 256: ~68%
* Size 512: ~68.5%
* Size 1024: ~68.5% (plateaus)
**2. ViT-JFT (Blue, ●, Dashed):**
* **Trend:** Begins at a moderate accuracy and increases steadily, eventually converging with the top-performing models at larger sizes.
* **Data Points (Approximate):**
* Size 8: ~54%
* Size 16: ~59%
* Size 32: ~63%
* Size 64: ~67%
* Size 128: ~70%
* Size 256: ~71%
* Size 512: ~71.5%
* Size 1024: ~71.5% (plateaus)
**3. RN50-IN1K (Purple, ■, Dashed):**
* **Trend:** Starts as the highest-performing model at the smallest size and maintains a lead until very large sizes, where others catch up. Shows a rapid initial rise followed by a gentle plateau.
* **Data Points (Approximate):**
* Size 8: ~62%
* Size 16: ~68%
* Size 32: ~69%
* Size 64: ~70%
* Size 128: ~70.5%
* Size 256: ~71%
* Size 512: ~71.5%
* Size 1024: ~71.5% (plateaus)
**4. ViT-ALIGN-Int (Red, ▼, Dotted):**
* **Trend:** Follows a nearly identical trajectory to its base model (ViT-ALIGN), but is consistently offset slightly higher across all sizes.
* **Data Points (Approximate):** Consistently ~1-2 percentage points above the green ViT-ALIGN line at each corresponding size.
**5. ViT-JFT-Int (Red, ●, Dotted):**
* **Trend:** Follows a nearly identical trajectory to its base model (ViT-JFT), but is consistently offset slightly higher across all sizes.
* **Data Points (Approximate):** Consistently ~1-2 percentage points above the blue ViT-JFT line at each corresponding size.
**6. RN50-IN1K-Int (Red, ■, Dotted):**
* **Trend:** Follows a nearly identical trajectory to its base model (RN50-IN1K), but is consistently offset slightly higher across all sizes.
* **Data Points (Approximate):** Consistently ~0.5-1.5 percentage points above the purple RN50-IN1K line at each corresponding size.
### Key Observations
1. **Performance Hierarchy at Small Sizes:** At the smallest representation size (8), there is a clear performance hierarchy: RN50-IN1K > ViT-JFT > ViT-ALIGN.
2. **Convergence at Large Sizes:** All six models converge to a very similar accuracy range (approximately 68.5% to 71.5%) as the representation size increases beyond 256. The performance gap narrows dramatically.
3. **Effect of the "-Int" Variant:** For all three base models, the "-Int" variant (red dotted lines) provides a consistent, small but positive boost in accuracy across the entire range of representation sizes. The boost appears slightly more pronounced for the ViT-based models than for the RN50 model.
4. **Scaling Efficiency:** The ViT-ALIGN model shows the steepest learning curve, suggesting it benefits the most from increased dimensionality. The RN50-IN1K model shows the most efficient use of very low-dimensional representations.
5. **Plateau:** All models exhibit a performance plateau starting around representation size 256 or 512, with negligible gains from further doubling the size to 1024 or 2048.
### Interpretation
This chart demonstrates the relationship between the dimensionality of a model's learned representations and its performance on a 1-NN classification task, which is a common probe for representation quality.
* **Model Architecture & Pre-training Matter:** The initial performance gap highlights differences in the inherent quality of the representations produced by different architectures (ResNet-50 vs. Vision Transformer) and pre-training objectives/datasets ( ALIGN, JFT, ImageNet-1K). RN50-IN1K starts strong, suggesting its features are highly discriminative even in very low dimensions.
* **The "-Int" Improvement:** The consistent, small uplift from the "-Int" method across all models and sizes suggests it is a robust technique for refining representations, possibly through interpolation in the feature space or integration of additional information.
* **The Curse (and Blessing) of Dimensionality:** The chart visualizes a key machine learning concept. Initially, adding dimensions provides significant gains as the model can capture more nuanced features. However, beyond a certain point (here, ~256-512 dims), the returns diminish sharply. This indicates the models have captured most of the useful discriminative information available for this task, and further increasing dimensionality adds little value while increasing computational cost.
* **Practical Implication:** For applications using these representations with a 1-NN classifier, there is a clear efficiency-accuracy trade-off. Choosing a representation size of 128 or 256 offers near-peak accuracy without the computational overhead of using 1024+ dimensions. The choice between base models would depend on the available compute budget at inference time and the specific size constraint.
DECODING INTELLIGENCE...