## Line Graph: 1-NN Accuracy vs. Representation Size
### Overview
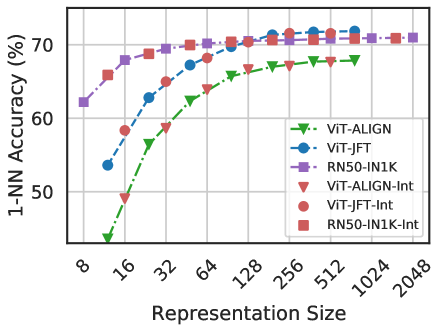
The image is a line graph comparing the 1-NN accuracy of different models across varying representation sizes. The x-axis represents representation size (8 to 2048), and the y-axis shows accuracy percentage (50% to 70%). Six data series are plotted with distinct line styles and markers, each corresponding to a model or variant.
### Components/Axes
- **X-axis (Representation Size)**: Logarithmic scale from 8 to 2048 (values: 8, 16, 32, 64, 128, 256, 512, 1024, 2048).
- **Y-axis (1-NN Accuracy %)**: Linear scale from 50% to 70%.
- **Legend**: Located in the bottom-right corner, mapping colors/markers to models:
- **Green dashed line with triangles**: ViT-ALIGN
- **Blue dashed line with circles**: ViT-JFT
- **Purple dashed line with squares**: RN50-IN1K
- **Green dashed line with triangles**: ViT-ALIGN-Int
- **Blue dashed line with circles**: ViT-JFT-Int
- **Purple dashed line with squares**: RN50-IN1K-Int
### Detailed Analysis
1. **ViT-ALIGN** (green dashed line with triangles):
- Starts at ~50% accuracy at 8 representation size.
- Gradually increases to ~65% at 2048.
- Slowest growth among all series.
2. **ViT-JFT** (blue dashed line with circles):
- Begins at ~55% at 8.
- Rises sharply to ~70% by 128.
- Plateaus near 70% for larger sizes.
3. **RN50-IN1K** (purple dashed line with squares):
- Starts at ~60% at 8.
- Increases to ~70% by 32.
- Remains stable at ~70% for larger sizes.
4. **ViT-ALIGN-Int** (green dashed line with triangles):
- Identical trend to ViT-ALIGN (same color/marker).
- Starts at ~50% and reaches ~65% at 2048.
5. **ViT-JFT-Int** (blue dashed line with circles):
- Matches ViT-JFT trend (same color/marker).
- Starts at ~55% and plateaus at ~70%.
6. **RN50-IN1K-Int** (purple dashed line with squares):
- Mirrors RN50-IN1K (same color/marker).
- Starts at ~60% and stabilizes at ~70%.
### Key Observations
- **Trend Consistency**: All models show increasing accuracy with larger representation sizes, but the rate of improvement varies.
- **Performance Hierarchy**: RN50-IN1K variants outperform ViT models, which outperform ViT-ALIGN variants.
- **Legend Ambiguity**: The "Int" variants (e.g., ViT-ALIGN-Int) share identical line styles and trends with their non-"Int" counterparts, suggesting potential labeling errors or redundancy.
- **Plateau Effect**: RN50-IN1K models plateau earlier (by 32) compared to ViT-JFT (128) and ViT-ALIGN (2048).
### Interpretation
The data demonstrates that larger representation sizes improve 1-NN accuracy across all models, with RN50-IN1K achieving the highest performance. The "Int" variants appear to replicate the trends of their base models, raising questions about their distinctiveness. The steepest growth is observed in ViT-JFT, suggesting it benefits most from increased representation size. The RN50-IN1K models’ early plateau indicates diminishing returns at smaller sizes, while ViT-ALIGN’s gradual improvement highlights its sensitivity to representation scale. The legend’s duplication of styles for "Int" variants warrants verification, as it may obscure meaningful distinctions between model configurations.