## Cumulative Distribution Function (CDF) of E2E Latency
### Overview
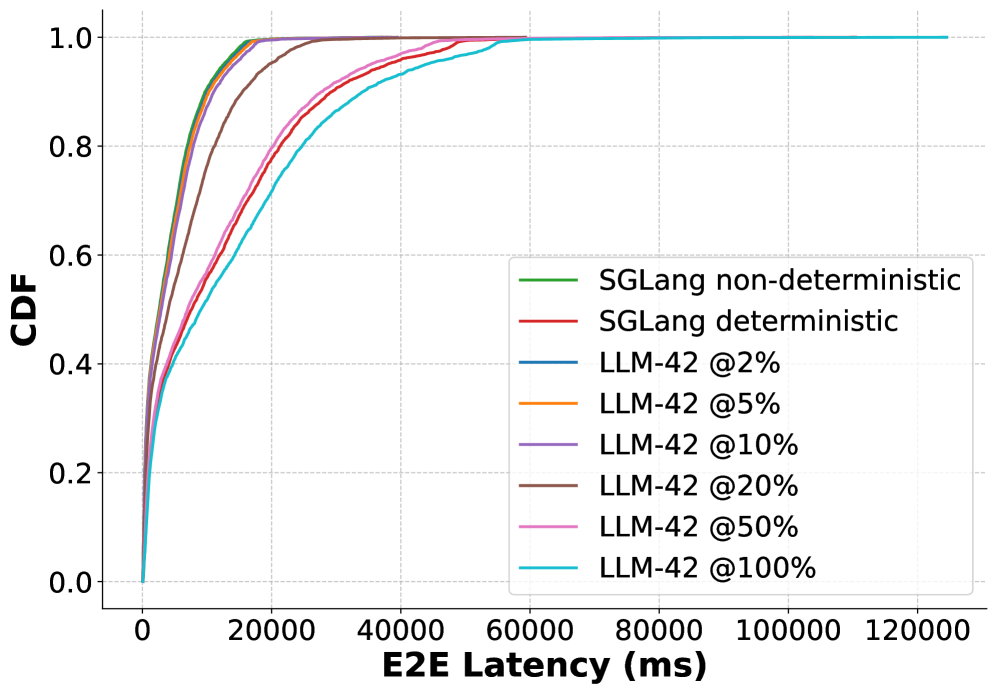
The image is a cumulative distribution function (CDF) plot comparing the end-to-end (E2E) latency of different language models (SGLang and LLM-42) under varying conditions. The x-axis represents E2E latency in milliseconds (ms), and the y-axis represents the cumulative distribution function (CDF), indicating the probability that the latency is less than or equal to a given value. The plot compares SGLang in non-deterministic and deterministic modes, as well as LLM-42 at different utilization levels (2%, 5%, 10%, 20%, 50%, and 100%).
### Components/Axes
* **X-axis:** E2E Latency (ms), ranging from 0 to 120,000 ms, with tick marks at intervals of 20,000 ms.
* **Y-axis:** CDF, ranging from 0.0 to 1.0, with tick marks at intervals of 0.2.
* **Legend:** Located in the top-right corner of the plot, the legend identifies each line by model and condition:
* Green: SGLang non-deterministic
* Red: SGLang deterministic
* Blue: LLM-42 @2%
* Orange: LLM-42 @5%
* Purple: LLM-42 @10%
* Brown: LLM-42 @20%
* Pink: LLM-42 @50%
* Cyan: LLM-42 @100%
### Detailed Analysis
* **SGLang non-deterministic (Green):** The green line rises sharply near the origin, reaching a CDF of 1.0 at approximately 10,000 ms. This indicates that almost all requests complete within 10,000 ms.
* **SGLang deterministic (Red):** The red line also rises sharply near the origin, but it is slightly to the right of the green line. It reaches a CDF of 1.0 at approximately 15,000 ms.
* **LLM-42 @2% (Blue):** The blue line rises sharply near the origin, reaching a CDF of 1.0 at approximately 20,000 ms.
* **LLM-42 @5% (Orange):** The orange line rises sharply near the origin, reaching a CDF of 1.0 at approximately 25,000 ms.
* **LLM-42 @10% (Purple):** The purple line rises sharply near the origin, reaching a CDF of 1.0 at approximately 30,000 ms.
* **LLM-42 @20% (Brown):** The brown line rises sharply near the origin, reaching a CDF of 1.0 at approximately 35,000 ms.
* **LLM-42 @50% (Pink):** The pink line rises sharply near the origin, reaching a CDF of 1.0 at approximately 40,000 ms.
* **LLM-42 @100% (Cyan):** The cyan line rises sharply near the origin, reaching a CDF of 1.0 at approximately 60,000 ms.
### Key Observations
* SGLang (both deterministic and non-deterministic) exhibits significantly lower E2E latency compared to LLM-42 at all utilization levels.
* As the utilization of LLM-42 increases, the E2E latency also increases. The 100% utilization case has the highest latency.
* The CDF curves for all models and conditions are generally steep, indicating that the latency is relatively consistent for each configuration.
### Interpretation
The data suggests that SGLang is more efficient in terms of E2E latency compared to LLM-42. The increase in latency for LLM-42 as utilization increases indicates a performance bottleneck or resource contention as the system becomes more loaded. The CDF plots provide a clear visualization of the distribution of latencies, allowing for a comparison of the performance characteristics of each model and condition. The steepness of the curves suggests that the latency is relatively predictable for each configuration, which is important for real-time applications.