## Chart: Cumulative Distribution Function (CDF) of E2E Latency
### Overview
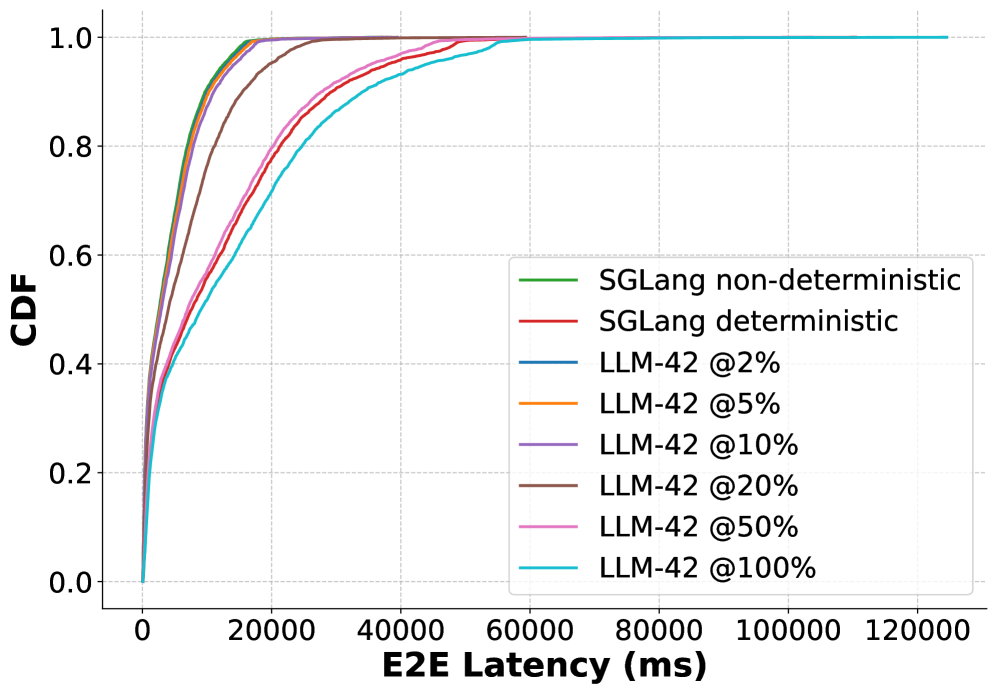
This image displays a Cumulative Distribution Function (CDF) plot comparing the End-to-End (E2E) latency performance of two different systems: **SGLang** (in both deterministic and non-deterministic modes) and **LLM-42** (configured at various percentage levels ranging from 2% to 100%). The chart illustrates the probability that a given request will complete within a specific latency threshold.
### Components/Axes
* **X-Axis:** "E2E Latency (ms)". The scale ranges from 0 to 120,000 ms, with major grid lines every 20,000 ms.
* **Y-Axis:** "CDF". The scale ranges from 0.0 to 1.0, representing the cumulative probability (0% to 100%).
* **Legend:** Located in the center-right of the chart area. It maps colors to the following configurations:
* **Green:** SGLang non-deterministic
* **Red:** SGLang deterministic
* **Blue:** LLM-42 @2%
* **Orange:** LLM-42 @5%
* **Purple:** LLM-42 @10%
* **Brown:** LLM-42 @20%
* **Pink:** LLM-42 @50%
* **Cyan:** LLM-42 @100%
### Detailed Analysis
The chart displays three distinct clusters of performance curves, moving from left (fastest) to right (slowest).
**1. High-Performance Cluster (Leftmost):**
* **Lines:** Green (SGLang non-deterministic), Red (SGLang deterministic), Blue (LLM-42 @2%), Orange (LLM-42 @5%), Purple (LLM-42 @10%).
* **Trend:** These lines exhibit the steepest upward slope, indicating the lowest latency.
* **Values:** These configurations reach a CDF of 1.0 (100% of requests completed) at approximately **15,000 ms to 20,000 ms**. The SGLang lines (Green/Red) are slightly faster than the low-percentage LLM-42 lines.
**2. Mid-Performance Cluster (Center):**
* **Line:** Brown (LLM-42 @20%).
* **Trend:** This line has a moderate slope, indicating higher latency than the high-performance cluster.
* **Values:** It reaches a CDF of 1.0 at approximately **40,000 ms**.
**3. Low-Performance Cluster (Rightmost):**
* **Lines:** Pink (LLM-42 @50%), Cyan (LLM-42 @100%).
* **Trend:** These lines have the shallowest slope, indicating the highest latency.
* **Values:** These configurations reach a CDF of 1.0 at approximately **60,000 ms**.
### Key Observations
* **Performance Degradation:** There is a clear, positive correlation between the LLM-42 percentage configuration and E2E latency. As the percentage increases from 2% to 100%, the latency significantly increases (the curve shifts to the right).
* **SGLang Efficiency:** SGLang (both deterministic and non-deterministic) consistently outperforms all LLM-42 configurations, even the lowest percentage (2%), though the gap between SGLang and LLM-42 @2% is relatively small.
* **Determinism:** There is no visible difference in latency performance between SGLang's deterministic and non-deterministic modes; the lines are effectively overlapping.
### Interpretation
The data demonstrates that SGLang is significantly more efficient in terms of E2E latency compared to the LLM-42 system.
The "LLM-42 @X%" likely refers to a load factor, sampling rate, or model complexity parameter. The fact that the latency increases as this percentage increases suggests that the LLM-42 system does not scale linearly or efficiently under higher loads/settings. Conversely, SGLang maintains a tight latency distribution, ensuring that nearly all requests are completed within 20 seconds, regardless of whether the system is operating in a deterministic or non-deterministic mode. This suggests SGLang is the superior choice for latency-sensitive applications compared to the tested LLM-42 configurations.