## CDF Chart: End-to-End Latency Comparison of SGLang and LLM-42 Variants
### Overview
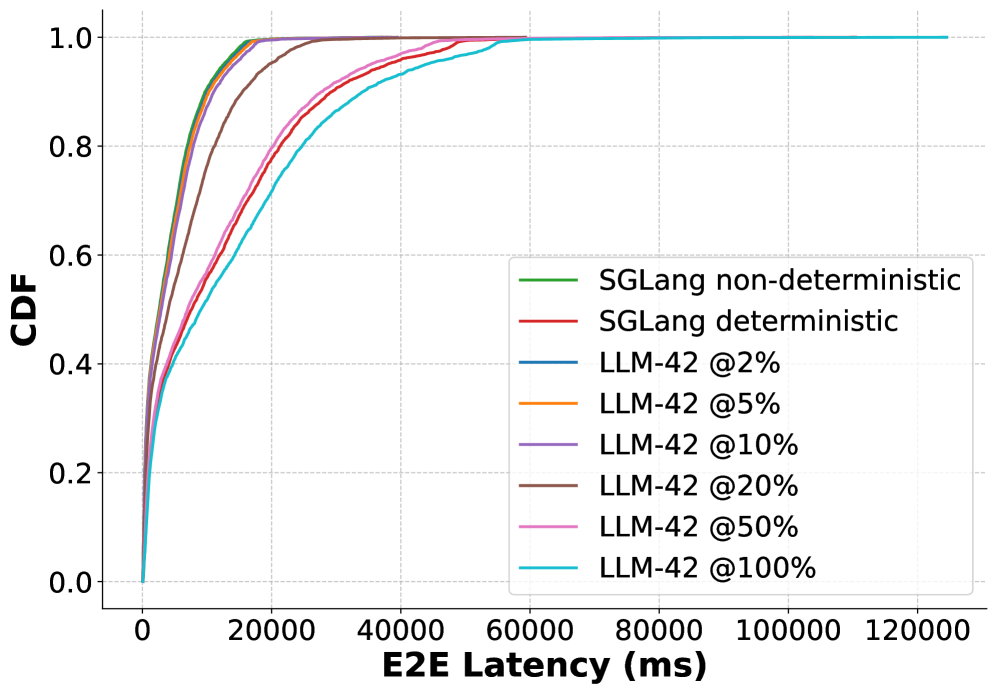
This image is a Cumulative Distribution Function (CDF) plot comparing the end-to-end (E2E) latency performance of two systems: "SGLang" (in deterministic and non-deterministic modes) and "LLM-42" (at various percentage configurations). The chart visualizes the probability (CDF) that a request's latency is less than or equal to a given value on the X-axis.
### Components/Axes
* **Chart Type:** Cumulative Distribution Function (CDF) line chart.
* **X-Axis:**
* **Label:** `E2E Latency (ms)`
* **Scale:** Linear scale from 0 to 120,000 milliseconds (ms).
* **Major Ticks:** 0, 20000, 40000, 60000, 80000, 100000, 120000.
* **Y-Axis:**
* **Label:** `CDF`
* **Scale:** Linear scale from 0.0 to 1.0.
* **Major Ticks:** 0.0, 0.2, 0.4, 0.6, 0.8, 1.0.
* **Legend:**
* **Position:** Bottom-right quadrant of the chart area.
* **Content (Listed in order as they appear in the legend box):**
1. `SGLang non-deterministic` (Green line)
2. `SGLang deterministic` (Red line)
3. `LLM-42 @2%` (Blue line)
4. `LLM-42 @5%` (Orange line)
5. `LLM-42 @10%` (Purple line)
6. `LLM-42 @20%` (Brown line)
7. `LLM-42 @50%` (Pink line)
8. `LLM-42 @100%` (Cyan/Light Blue line)
### Detailed Analysis
All data series originate at the coordinate (0, 0.0) and asymptote towards a CDF of 1.0. The primary difference is the rate of ascent, indicating latency distribution.
**Trend Verification & Key Data Points (Approximate):**
1. **SGLang non-deterministic (Green):**
* **Trend:** Steepest initial ascent. Reaches CDF ~0.9 at ~10,000 ms and CDF ~1.0 by ~20,000 ms.
* **Interpretation:** This configuration has the lowest latency for the vast majority of requests.
2. **SGLang deterministic (Red):**
* **Trend:** Very similar to the non-deterministic green line, but slightly less steep. Reaches CDF ~0.9 at ~12,000 ms and CDF ~1.0 by ~25,000 ms.
* **Interpretation:** Deterministic mode introduces a minor latency overhead compared to non-deterministic mode.
3. **LLM-42 Series (General Trend):** The latency increases as the percentage value increases. The curves become progressively less steep.
* **LLM-42 @2% (Blue) & @5% (Orange):** These two lines are nearly indistinguishable and track very closely to the SGLang deterministic (red) line, reaching CDF ~1.0 by ~30,000 ms.
* **LLM-42 @10% (Purple):** Slightly slower than the @2%/5% lines. Reaches CDF ~0.9 at ~18,000 ms.
* **LLM-42 @20% (Brown):** Noticeably slower. Reaches CDF ~0.8 at ~20,000 ms and CDF ~0.95 at ~40,000 ms.
* **LLM-42 @50% (Pink):** Significantly slower. Reaches CDF ~0.8 at ~30,000 ms and CDF ~0.95 at ~60,000 ms.
* **LLM-42 @100% (Cyan):** The slowest configuration by a wide margin. It has the most gradual slope. Reaches CDF ~0.6 at ~20,000 ms, CDF ~0.8 at ~40,000 ms, and CDF ~0.95 at ~80,000 ms. It approaches CDF 1.0 near the 120,000 ms mark.
### Key Observations
* **Performance Clustering:** The SGLang variants and LLM-42 @2%/5%/10% form a high-performance cluster, all achieving CDF >0.9 below 20,000 ms.
* **Clear Performance Degradation:** There is a clear, monotonic degradation in latency for LLM-42 as the configured percentage increases from 20% to 100%.
* **Long Tail Latency:** The LLM-42 @100% (cyan) line exhibits a pronounced "long tail," meaning a significant fraction of requests (the last 5-10%) experience very high latency (60,000 - 120,000 ms).
* **SGLang Determinism Overhead:** The performance gap between SGLang non-deterministic (green) and deterministic (red) is small but consistent across the entire distribution.
### Interpretation
This CDF chart is a powerful tool for comparing service-level performance beyond simple averages. It answers: "For what percentage of requests is the latency below X milliseconds?"
* **What the data suggests:** The SGLang system, in both modes, offers superior and more consistent low-latency performance compared to LLM-42 at higher percentage configurations. For LLM-42, the "@X%" parameter appears to be a direct trade-off knob between some other resource (likely cost, throughput, or quality) and latency. Setting it to 100% maximizes that resource but severely impacts response time consistency.
* **Relationship between elements:** The chart directly correlates a configuration parameter (the percentage for LLM-42, the mode for SGLang) with a critical performance metric (latency distribution). The tight grouping of the leftmost lines indicates a performance ceiling or optimal operating region for these systems under the tested conditions.
* **Notable Anomalies/Outliers:** The LLM-42 @100% line is a clear outlier in terms of tail latency. The near-overlap of the @2% and @5% lines suggests diminishing returns or a performance floor for LLM-42 at very low percentage settings. The chart does not provide the context for what the "@X%" parameter represents (e.g., GPU utilization cap, token budget, etc.), which is crucial for a full technical understanding.