## CDF Graph: E2E Latency Distribution Comparison
### Overview
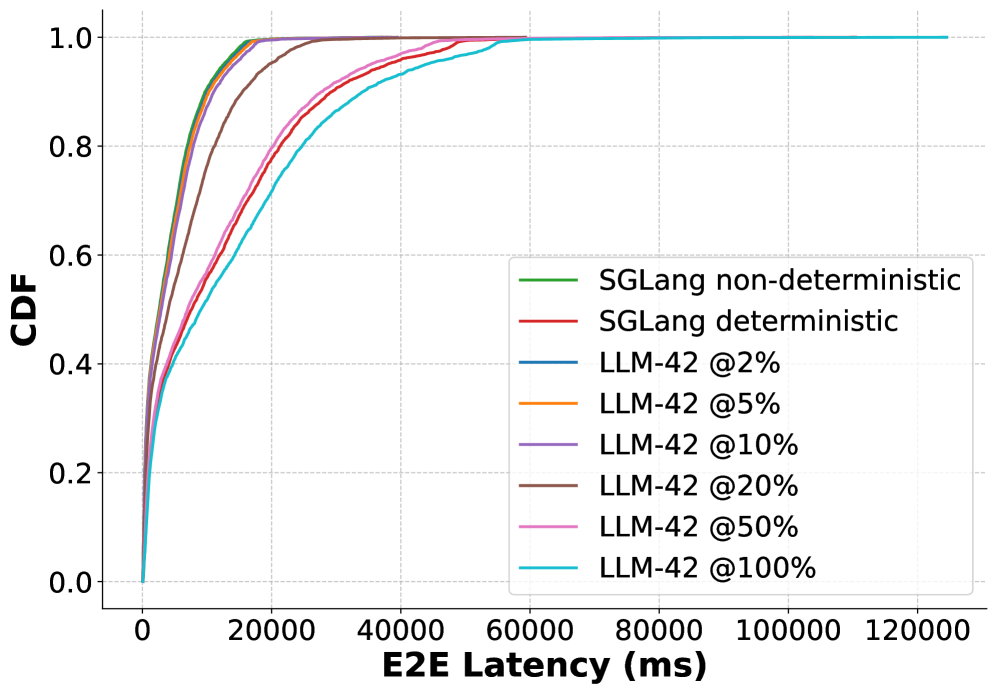
The image is a cumulative distribution function (CDF) graph comparing E2E latency distributions across different configurations. The x-axis represents E2E latency in milliseconds (0–120,000 ms), and the y-axis represents the CDF (0–1.0). Multiple lines depict latency distributions for SGLang (non-deterministic and deterministic) and LLM-42 at various percentiles (2%, 5%, 10%, 20%, 50%, 100%).
### Components/Axes
- **X-axis**: E2E Latency (ms) [0, 20,000, 40,000, 60,000, 80,000, 100,000, 120,000]
- **Y-axis**: CDF [0.0, 0.2, 0.4, 0.6, 0.8, 1.0]
- **Legend**: Located in the top-right corner, mapping colors to configurations:
- Green: SGLang non-deterministic
- Red: SGLang deterministic
- Blue: LLM-42 @2%
- Orange: LLM-42 @5%
- Purple: LLM-42 @10%
- Brown: LLM-42 @20%
- Pink: LLM-42 @50%
- Cyan: LLM-42 @100%
### Detailed Analysis
1. **SGLang Non-Deterministic (Green)**:
- Starts steeply, reaching ~0.95 CDF at ~20,000 ms.
- Plateaus near 1.0 by ~40,000 ms.
- Slightly higher than the deterministic variant, indicating lower latency.
2. **SGLang Deterministic (Red)**:
- Similar shape to non-deterministic but lags by ~5,000 ms.
- Reaches ~0.95 CDF at ~25,000 ms and plateaus by ~45,000 ms.
3. **LLM-42 Percentiles**:
- **@2% (Blue)**: Steepest rise, reaching 1.0 by ~30,000 ms.
- **@5% (Orange)**: Slower rise, plateaus near 1.0 by ~40,000 ms.
- **@10% (Purple)**: Reaches 1.0 by ~50,000 ms.
- **@20% (Brown)**: Plateaus near 1.0 by ~60,000 ms.
- **@50% (Pink)**: Reaches 1.0 by ~80,000 ms.
- **@100% (Cyan)**: Highest latency, plateaus near 1.0 by ~120,000 ms.
### Key Observations
- **SGLang vs. LLM-42**: SGLang configurations (green/red) consistently outperform LLM-42 across all percentiles, with lower latency and steeper CDF curves.
- **Percentile Correlation**: Higher percentiles for LLM-42 (e.g., 50%, 100%) correspond to significantly higher latency, indicating greater variability in response times.
- **Deterministic vs. Non-Deterministic**: SGLang non-deterministic (green) achieves lower latency than deterministic (red), suggesting non-deterministic processing may optimize performance.
### Interpretation
The graph demonstrates that SGLang (both deterministic and non-deterministic) exhibits lower and more consistent latency compared to LLM-42. The LLM-42 percentiles reveal a trade-off between latency and coverage: higher percentiles (e.g., 100%) capture extreme latency values but at the cost of performance. The deterministic variant of SGLang lags slightly behind its non-deterministic counterpart, implying that non-deterministic processing might prioritize speed over strict consistency. This data could inform system design choices, favoring SGLang for latency-sensitive applications.