## Diagram: Query Path Templates
### Overview
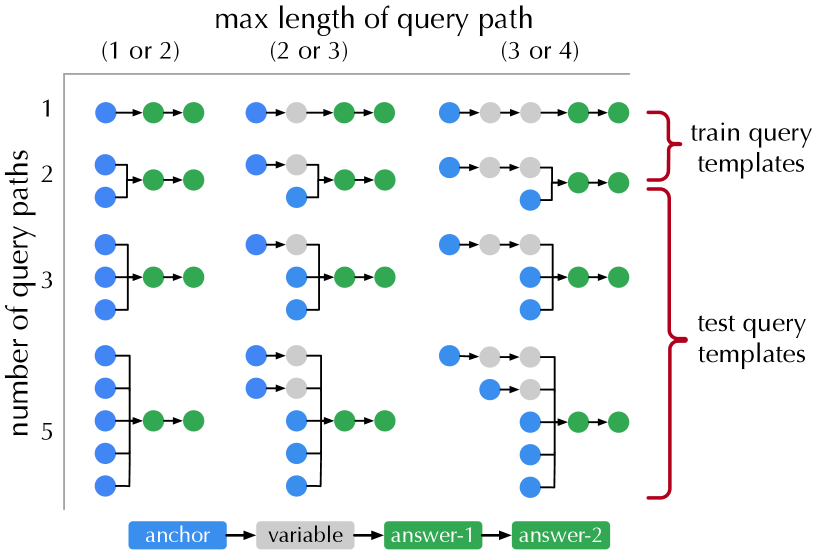
The image presents a diagram illustrating different query path templates used for training and testing. The diagram is organized in a grid format, with the number of query paths on the vertical axis and the maximum length of the query path on the horizontal axis. Each cell in the grid shows a specific query path template, represented by colored circles (blue, gray, and green) connected by arrows. The diagram distinguishes between "train query templates" and "test query templates."
### Components/Axes
* **Vertical Axis:** "number of query paths" with values 1, 2, 3, and 5.
* **Horizontal Axis:** "max length of query path" with categories (1 or 2), (2 or 3), and (3 or 4).
* **Legend (bottom):**
* Blue circle: "anchor"
* Gray circle: "variable"
* Green circle: "answer-1"
* Green circle: "answer-2"
* **Right Side:**
* "train query templates" (associated with the first two rows)
* "test query templates" (associated with the last two rows)
### Detailed Analysis
The diagram is structured as a grid, where each cell represents a different query path template. The rows correspond to the number of query paths (1, 2, 3, 5), and the columns correspond to the maximum length of the query path (1 or 2, 2 or 3, 3 or 4). Each template is a sequence of colored circles connected by arrows, representing the path from the anchor to the answer(s).
Here's a breakdown of each cell:
* **Row 1 (number of query paths = 1):**
* Column 1 (max length of query path = 1 or 2): Blue -> Green
* Column 2 (max length of query path = 2 or 3): Blue -> Gray -> Green
* Column 3 (max length of query path = 3 or 4): Blue -> Gray -> Gray -> Green
* **Row 2 (number of query paths = 2):**
* Column 1 (max length of query path = 1 or 2): Blue -> Green, Blue -> Green
* Column 2 (max length of query path = 2 or 3): Blue -> Gray, Blue -> Green -> Green
* Column 3 (max length of query path = 3 or 4): Blue -> Gray -> Gray, Blue -> Green -> Green
* **Row 3 (number of query paths = 3):**
* Column 1 (max length of query path = 1 or 2): Blue -> Green, Blue, Blue
* Column 2 (max length of query path = 2 or 3): Blue -> Gray, Blue, Blue -> Green
* Column 3 (max length of query path = 3 or 4): Blue -> Gray -> Gray, Blue, Blue -> Green
* **Row 5 (number of query paths = 5):**
* Column 1 (max length of query path = 1 or 2): Blue -> Green, Blue, Blue, Blue, Blue
* Column 2 (max length of query path = 2 or 3): Blue -> Gray, Blue, Blue, Blue, Blue -> Green
* Column 3 (max length of query path = 3 or 4): Blue -> Gray -> Gray, Blue, Blue, Blue, Blue -> Green
### Key Observations
* The "train query templates" (rows 1 and 2) have simpler structures compared to the "test query templates" (rows 3 and 5).
* As the "max length of query path" increases, the templates include more "variable" (gray) nodes.
* As the "number of query paths" increases, the templates include more "anchor" (blue) nodes.
* The "answer-1" and "answer-2" nodes are always green.
### Interpretation
The diagram illustrates the different types of query paths used for training and testing a model. The "train query templates" are simpler, likely used to initially train the model on basic relationships. The "test query templates" are more complex, designed to evaluate the model's ability to handle more intricate queries. The number of query paths and the maximum length of the query path are key parameters that define the complexity of the query. The diagram highlights how these parameters are varied to create different query templates for training and testing. The use of "anchor," "variable," and "answer" nodes indicates the structure of the queries and the relationships between entities.