## Diagram: Query Template Structure by Path Length and Number
### Overview
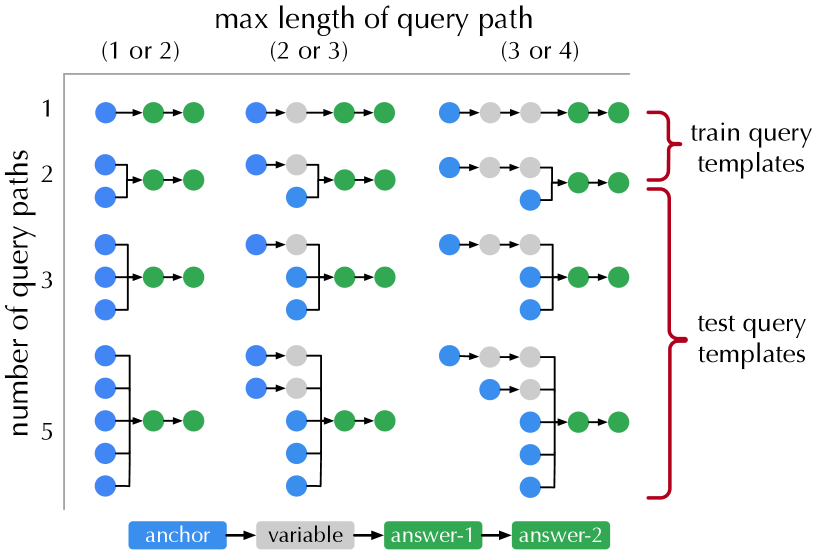
This image is a technical diagram illustrating the structure of query templates used in a machine learning or information retrieval context. It categorizes templates based on two parameters: the "max length of query path" (columns) and the "number of query paths" (rows). The diagram uses a grid layout to show how the composition of a query—defined by a sequence of colored nodes (anchor, variable, answer-1, answer-2)—changes across these parameters. A clear separation is made between templates used for training and those used for testing.
### Components/Axes
* **Title:** "max length of query path" (centered at the top).
* **Column Headers (X-axis categories):** Three categories defining the maximum sequence length:
* (1 or 2)
* (2 or 3)
* (3 or 4)
* **Row Labels (Y-axis):** "number of query paths" (vertical label on the left). The rows are numbered 1, 2, 3, and 5. There is no row for 4 paths.
* **Legend (Bottom Center):** A key explaining the color-coded node types:
* Blue circle: `anchor`
* Gray circle: `variable`
* Green circle: `answer-1`
* Green circle: `answer-2` (Note: Both answer nodes share the same green color).
* **Grouping Braces (Right Side):** Two red braces categorize the rows:
* The brace spanning rows 1 and 2 is labeled "train query templates".
* The brace spanning rows 3 and 5 is labeled "test query templates".
### Detailed Analysis
The diagram presents a 5-row by 3-column grid. Each cell contains one or more directed sequences (paths) of colored nodes. The structure becomes more complex moving down the rows (more paths) and right across the columns (longer max path length).
**Row 1 (1 path):**
* **Column (1 or 2):** A single path: `anchor` (blue) → `answer-1` (green). (Length = 2)
* **Column (2 or 3):** A single path: `anchor` (blue) → `variable` (gray) → `answer-1` (green). (Length = 3)
* **Column (3 or 4):** A single path: `anchor` (blue) → `variable` (gray) → `variable` (gray) → `answer-1` (green). (Length = 4)
**Row 2 (2 paths):**
* **Column (1 or 2):** Two parallel paths, each: `anchor` (blue) → `answer-1` (green). Both paths are identical.
* **Column (2 or 3):** Two paths. Path 1: `anchor` (blue) → `variable` (gray) → `answer-1` (green). Path 2: `anchor` (blue) → `answer-1` (green). The second path is shorter.
* **Column (3 or 4):** Two paths. Path 1: `anchor` (blue) → `variable` (gray) → `variable` (gray) → `answer-1` (green). Path 2: `anchor` (blue) → `variable` (gray) → `answer-1` (green). The second path is shorter.
**Row 3 (3 paths - Start of "test query templates"):**
* **Column (1 or 2):** Three parallel paths, each: `anchor` (blue) → `answer-1` (green).
* **Column (2 or 3):** Three paths. Path 1: `anchor` (blue) → `variable` (gray) → `answer-1` (green). Paths 2 & 3: `anchor` (blue) → `answer-1` (green).
* **Column (3 or 4):** Three paths. Path 1: `anchor` (blue) → `variable` (gray) → `variable` (gray) → `answer-1` (green). Paths 2 & 3: `anchor` (blue) → `variable` (gray) → `answer-1` (green).
**Row 5 (5 paths):**
* **Column (1 or 2):** Five parallel paths, each: `anchor` (blue) → `answer-1` (green).
* **Column (2 or 3):** Five paths. Path 1: `anchor` (blue) → `variable` (gray) → `answer-1` (green). Paths 2-5: `anchor` (blue) → `answer-1` (green).
* **Column (3 or 4):** Five paths. Path 1: `anchor` (blue) → `variable` (gray) → `variable` (gray) → `answer-1` (green). Paths 2-5: `anchor` (blue) → `variable` (gray) → `answer-1` (green).
### Key Observations
1. **Structural Progression:** Within any given row, the complexity of the *longest* path increases from left to right, adding one `variable` node per column step. The number of paths is fixed per row.
2. **Template Heterogeneity:** For rows with more than one path (rows 2, 3, 5), the paths are not identical. The first path is always the longest possible for that column's constraint. The subsequent paths are shorter, often matching the structure from the previous column.
3. **Train vs. Test Split:** The diagram explicitly separates simpler templates (1 or 2 paths) for training from more complex ones (3 or 5 paths) for testing. This suggests a evaluation setup where models are tested on their ability to handle a greater number of simultaneous query paths.
4. **Answer Node Consistency:** All query sequences terminate with an `answer-1` node. The `answer-2` node, while present in the legend, does not appear in any of the depicted query paths in this specific diagram.
### Interpretation
This diagram defines a controlled experimental setup for evaluating systems that process structured queries, likely in areas like semantic parsing, question answering over knowledge bases, or multi-hop reasoning.
* **What it demonstrates:** It systematically generates query templates of varying difficulty. Difficulty is controlled by two axes: **path length** (requiring the model to handle longer chains of reasoning) and **path breadth/number** (requiring the model to manage multiple parallel or interacting reasoning threads).
* **Relationship between elements:** The grid structure shows a combinatorial approach to creating test cases. The "train" templates are simpler, likely used to teach a model the basic building blocks (`anchor`, `variable`, `answer`). The "test" templates are more complex, assessing the model's ability to generalize to scenarios with more concurrent paths and longer dependencies.
* **Notable pattern:** The consistent design where the first path in a multi-path cell is the most complex suggests a focus on evaluating the system's capacity to handle a primary, complex query alongside several simpler, possibly supporting or distractor, queries. The absence of `answer-2` in the paths indicates that for this specific set of templates, each query path yields a single answer, and the challenge lies in managing multiple such paths, not in generating multiple answers per path.
* **Underlying purpose:** This framework allows researchers to pinpoint a model's failure modes. Does performance degrade with longer paths, with more paths, or with a combination of both? The clear separation between train and test distributions also guards against overfitting to simple query structures.