## Chart: Receiver Operating Characteristic (ROC) Curves
### Overview
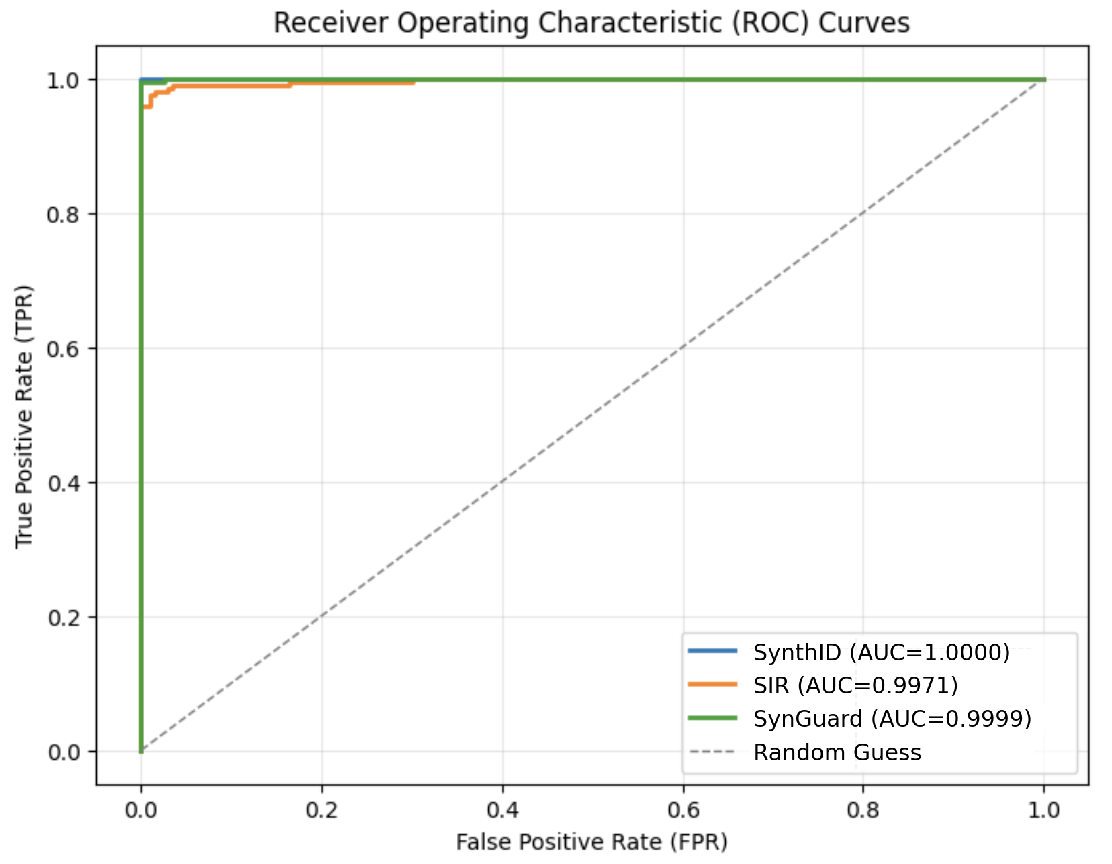
The image is a Receiver Operating Characteristic (ROC) curve chart, comparing the performance of three models: SynthID, SIR, and SynGuard, against a random guess baseline. The chart plots the True Positive Rate (TPR) against the False Positive Rate (FPR). The Area Under the Curve (AUC) is provided for each model.
### Components/Axes
* **Title:** Receiver Operating Characteristic (ROC) Curves
* **X-axis:** False Positive Rate (FPR), ranging from 0.0 to 1.0 in increments of 0.2.
* **Y-axis:** True Positive Rate (TPR), ranging from 0.0 to 1.0 in increments of 0.2.
* **Legend:** Located in the bottom-right corner.
* SynthID (AUC=1.0000) - Blue line
* SIR (AUC=0.9971) - Orange line
* SynGuard (AUC=0.9999) - Green line
* Random Guess - Dashed gray line
### Detailed Analysis
* **SynthID (Blue):** The line rises vertically at FPR=0.0 to TPR=1.0, then continues horizontally to FPR=1.0. This indicates perfect classification performance.
* **SIR (Orange):** The line rises sharply near FPR=0.0 to a TPR of approximately 0.95-1.0, then continues horizontally to FPR=1.0.
* **SynGuard (Green):** The line rises vertically at FPR=0.0 to a TPR of approximately 0.98-1.0, then continues horizontally to FPR=1.0.
* **Random Guess (Dashed Gray):** A diagonal line from (0.0, 0.0) to (1.0, 1.0), representing the performance of a classifier that randomly guesses the outcome.
### Key Observations
* SynthID has a perfect AUC score of 1.0000, indicating perfect classification.
* SynGuard has a very high AUC score of 0.9999, very close to perfect classification.
* SIR has a slightly lower AUC score of 0.9971, but still performs significantly better than random guessing.
* All three models outperform the random guess baseline.
### Interpretation
The ROC curves demonstrate the effectiveness of the SynthID, SIR, and SynGuard models in distinguishing between positive and negative cases. SynthID achieves perfect classification, while SynGuard and SIR also exhibit excellent performance. The AUC values quantify the overall performance of each model, with higher values indicating better discrimination ability. The curves show that all three models are significantly better than random guessing, making them useful for classification tasks.