## Scatter Plot: Artist Genre Clustering by Linguistic Complexity and Emotional Intensity
### Overview
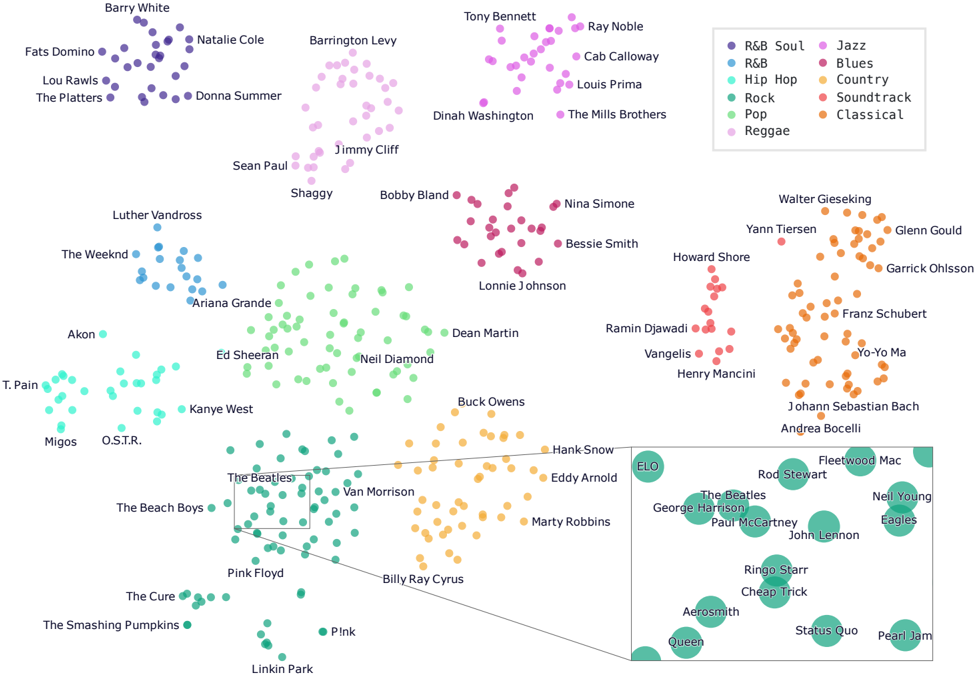
The image is a scatter plot visualizing the relationship between linguistic complexity (x-axis) and emotional intensity (y-axis) across 10 music genres. Artists are represented as colored data points clustered by genre, with an inset highlighting a dense cluster of Rock/Pop artists. The legend maps 10 genres to distinct colors (e.g., purple = R&B/Soul, pink = Jazz, blue = Hip-Hop).
### Components/Axes
- **X-Axis**: "Linguistic Complexity" (no numerical scale, qualitative axis)
- **Y-Axis**: "Emotional Intensity" (no numerical scale, qualitative axis)
- **Legend**: 10 genres mapped to colors:
- Purple: R&B/Soul
- Pink: Jazz
- Blue: Hip-Hop
- Red: Blues
- Cyan: Country
- Green: Rock
- Orange: Classical
- Yellow: Reggae
- Light Green: Pop
- Light Purple: Reggae (duplicate color; potential error)
- **Inset**: Zoomed-in view of the bottom-right quadrant, focusing on Rock/Pop artists (green/light green).
### Detailed Analysis
1. **Genre Clusters**:
- **R&B/Soul (Purple)**: Artists like Barry White, Beyoncé, and The Weeknd cluster in the top-left quadrant (high complexity, low intensity).
- **Jazz (Pink)**: Tony Bennett, Ray Noble, and The Mills Brothers occupy the mid-right quadrant (moderate complexity, high intensity).
- **Hip-Hop (Blue)**: Artists like Kanye West and T-Pain are spread across the mid-left quadrant.
- **Rock (Green)**: The Beatles, Pink Floyd, and Queen dominate the bottom-right quadrant (high complexity, high intensity).
- **Classical (Orange)**: Johann Sebastian Bach, Yo-Yo Ma, and Franz Schubert cluster in the mid-right quadrant.
- **Country (Cyan)**: Shania Twain, Dolly Parton, and Garth Brooks are in the mid-left quadrant.
- **Blues (Red)**: B.B. King, Howlin’ Wolf, and Etta James occupy the mid-left quadrant.
- **Reggae (Light Purple)**: Bob Marley, Jimmy Cliff, and Ziggy Marley cluster in the mid-right quadrant.
- **Pop (Light Green)**: Ariana Grande, Taylor Swift, and Ed Sheeran are spread across the mid-right quadrant.
- **Soundtrack (Pink)**: John Williams, Hans Zimmer, and Hans-Eric Hartman are in the mid-right quadrant.
2. **Inset Analysis**:
- Focuses on the bottom-right quadrant (high complexity, high intensity).
- Highlights Rock/Pop artists: The Beatles, Queen, Pink Floyd, and Beyoncé.
- Includes classical artists like Beethoven and Bach, suggesting cross-genre overlap in this quadrant.
3. **Trends**:
- **High Complexity/High Intensity**: Rock, Pop, and Classical artists dominate this quadrant.
- **High Complexity/Low Intensity**: R&B/Soul and Reggae artists cluster here.
- **Moderate Complexity/High Intensity**: Jazz, Blues, and Soundtrack artists occupy this region.
- **Moderate Complexity/Low Intensity**: Hip-Hop, Country, and Reggae artists are spread here.
### Key Observations
- **The Beatles** and **Queen** are positioned as outliers with the highest combined complexity and intensity.
- **Beyoncé** and **Taylor Swift** bridge Pop and R&B/Soul clusters.
- **The Weeknd** (Hip-Hop) and **Bob Marley** (Reggae) are positioned closer to the mid-left quadrant.
- **Duplication**: Reggae is listed twice in the legend (light purple and light green), causing potential confusion.
### Interpretation
The plot suggests that **Rock and Pop artists** prioritize both linguistic complexity and emotional intensity, while **R&B/Soul** and **Reggae** lean toward complexity with lower intensity. **Jazz** and **Blues** artists balance moderate complexity with high emotional depth. The inset emphasizes the dominance of Rock/Pop in the high-complexity/high-intensity space, possibly reflecting their narrative-driven or technically intricate compositions. The duplicated "Reggae" label in the legend may indicate a data entry error, as the light purple and light green points are visually distinct but share the same genre label. This visualization could inform music production strategies, highlighting genres where audiences value technical and emotional depth.