## Heatmap: Attention and MLP Weights
### Overview
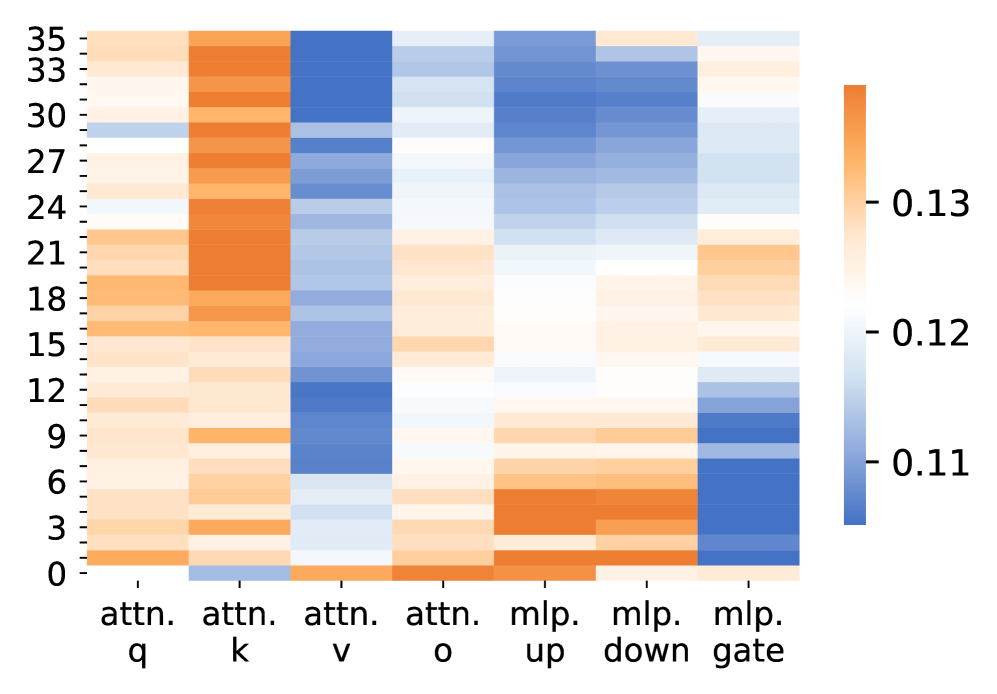
The image is a heatmap visualizing the weights associated with different components of an attention mechanism and a multilayer perceptron (MLP). The heatmap uses a color gradient from blue to orange, where blue represents lower weights (around 0.11) and orange represents higher weights (around 0.13). The y-axis represents a numerical scale from 0 to 35, and the x-axis represents different components: attention query (attn. q), attention key (attn. k), attention value (attn. v), attention output (attn. o), MLP up, MLP down, and MLP gate.
### Components/Axes
* **Y-axis:** Numerical scale from 0 to 35, with tick marks at intervals of 3 (0, 3, 6, 9, 12, 15, 18, 21, 24, 27, 30, 33, 35).
* **X-axis:** Categorical labels representing different components:
* attn. q (attention query)
* attn. k (attention key)
* attn. v (attention value)
* attn. o (attention output)
* mlp. up (MLP up)
* mlp. down (MLP down)
* mlp. gate (MLP gate)
* **Color Legend (Right Side):**
* Orange: ~0.13
* White: ~0.12
* Blue: ~0.11
### Detailed Analysis
* **attn. q (attention query):** Predominantly orange, indicating higher weights across the entire range of the y-axis.
* **attn. k (attention key):** Similar to attn. q, mostly orange, indicating higher weights.
* **attn. v (attention value):** Predominantly blue, indicating lower weights, especially between y-axis values of approximately 6 and 24.
* **attn. o (attention output):** A mix of orange and blue, with higher weights (orange) concentrated at the top (y > 27) and bottom (y < 6), and lower weights (blue) in the middle.
* **mlp. up (MLP up):** Mostly blue, indicating lower weights, with a slight increase towards orange around y = 30.
* **mlp. down (MLP down):** Mostly orange, indicating higher weights, with some blue regions.
* **mlp. gate (MLP gate):** Blue at the top (y > 24), orange in the middle (6 < y < 24), and blue again at the bottom (y < 6).
### Key Observations
* Attention query and key components (attn. q and attn. k) consistently show higher weights across all y-axis values.
* Attention value (attn. v) shows significantly lower weights compared to query and key.
* MLP up consistently shows lower weights, while MLP down shows higher weights.
* MLP gate exhibits a mixed pattern, with lower weights at the extremes and higher weights in the middle.
### Interpretation
The heatmap visualizes the relative importance or contribution of different components in an attention mechanism and an MLP. The higher weights for attention query and key suggest that these components play a crucial role in the attention process. The lower weights for attention value might indicate a different scaling or transformation applied to this component. The differences in weights between MLP up and MLP down could reflect the flow of information or the specific function of these layers within the MLP. The varying weights of the MLP gate suggest it modulates the flow of information differently depending on the input. Overall, the heatmap provides insights into the internal workings of the model and the relative importance of its different components.