\n
## Heatmap: Attention and MLP Layer Correlation
### Overview
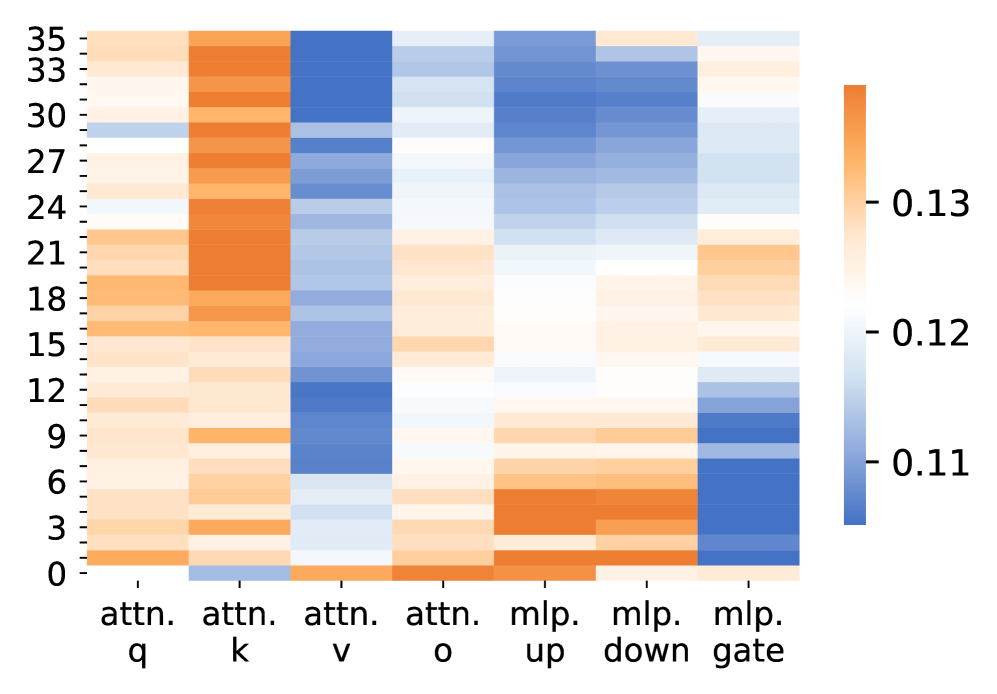
The image presents a heatmap visualizing correlation values between different layers within a neural network architecture. The layers are labeled as "attn. q", "attn. k", "attn. v", "attn. o", "mlp. up", "mlp. down", and "mlp. gate". The heatmap displays correlation values ranging from approximately 0.11 to 0.13. The vertical axis represents a numerical index from 0 to 35.
### Components/Axes
* **X-axis:** Represents the different layers: "attn. q", "attn. k", "attn. v", "attn. o", "mlp. up", "mlp. down", "mlp. gate".
* **Y-axis:** Represents a numerical index ranging from 0 to 35, with increments of 3. The values are: 0, 3, 6, 9, 12, 15, 18, 21, 24, 27, 30, 33, 35.
* **Color Scale (Legend):** Located on the right side of the heatmap. It ranges from approximately 0.11 (blue) to 0.13 (orange).
* **Data Representation:** The heatmap uses color intensity to represent correlation values.
### Detailed Analysis
The heatmap shows correlation values for each layer combination across the index range.
* **attn. q:** Values are predominantly orange, indicating higher correlation values (around 0.12-0.13) across the entire index range. There's a slight gradient, with values appearing slightly lower towards the top (index 0-6) and slightly higher towards the bottom (index 27-35).
* **attn. k:** Similar to "attn. q", values are mostly orange, with a range of approximately 0.12-0.13. A slight gradient is visible, with a minor decrease in correlation towards the top of the index range.
* **attn. v:** Displays a mix of orange and light blue. The correlation values are generally lower than "attn. q" and "attn. k", ranging from approximately 0.11 to 0.13. There's a noticeable gradient, with lower values at the top (index 0-9) and higher values towards the bottom (index 24-35).
* **attn. o:** Shows a similar pattern to "attn. v", with a mix of orange and light blue. Correlation values range from approximately 0.11 to 0.13, with a gradient from lower values at the top to higher values at the bottom.
* **mlp. up:** Predominantly light blue, indicating lower correlation values (around 0.11-0.12). The values are relatively consistent across the index range.
* **mlp. down:** Displays a mix of light blue and orange. Correlation values range from approximately 0.11 to 0.13, with a gradient from lower values at the top to higher values at the bottom.
* **mlp. gate:** Shows a mix of light blue and orange, with a more pronounced gradient. Correlation values range from approximately 0.11 to 0.13, with lower values at the top and higher values at the bottom.
### Key Observations
* The "attn. q" and "attn. k" layers consistently exhibit the highest correlation values across the index range.
* "mlp. up" consistently shows the lowest correlation values.
* "attn. v", "attn. o", "mlp. down", and "mlp. gate" show a gradient in correlation values, increasing from the top to the bottom of the index range.
* The correlation values are relatively small, ranging only from 0.11 to 0.13.
### Interpretation
The heatmap suggests that the query and key attention mechanisms ("attn. q" and "attn. k") are strongly correlated with each other throughout the different indices. This could indicate that these layers are working in a coordinated manner to process information. The lower correlation values observed in the "mlp. up" layer suggest that this layer might be more independent or have a different role in the network's processing. The gradient observed in "attn. v", "attn. o", "mlp. down", and "mlp. gate" could indicate that the correlation between these layers changes as the network processes information at different stages (represented by the index). The small magnitude of the correlation values overall suggests that the layers are not strongly dependent on each other, which could be a characteristic of a well-designed neural network architecture that promotes diversity and avoids overfitting. The heatmap provides insights into the relationships between different layers within the network, which can be useful for understanding the network's behavior and identifying potential areas for improvement.