## Heatmap: Attention and MLP Component Values Across Rows
### Overview
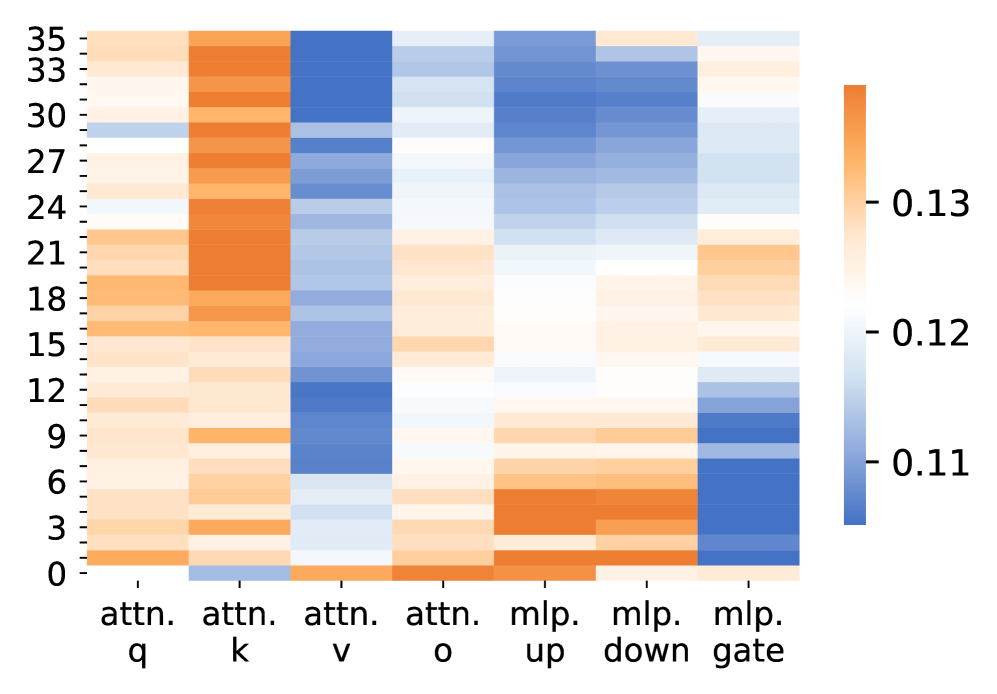
The image is a heatmap visualizing numerical values across 36 rows (0-35) and 7 columns representing attention mechanisms ("attn. q", "attn. k", "attn. v", "attn. o") and MLP components ("mlp. up", "mlp. down", "mlp. gate"). Values range from 0.11 (blue) to 0.13 (orange), with intermediate shades of white and light blue.
### Components/Axes
- **X-axis (Columns)**:
- "attn. q", "attn. k", "attn. v", "attn. o" (attention mechanisms)
- "mlp. up", "mlp. down", "mlp. gate" (MLP components)
- **Y-axis (Rows)**: Numerical labels 0 to 35 (increasing downward)
- **Legend**:
- Blue → 0.11, Light Blue → 0.12, Orange → 0.13
- Positioned vertically on the right side of the heatmap
### Detailed Analysis
1. **attn. q Column**:
- Dark blue (0.11) dominates rows 33-35 (top of heatmap)
- Gradual transition to lighter blue/orange in rows 0-20
- Row 24 shows a distinct white band (0.12)
2. **attn. k Column**:
- Consistent orange (0.13) in rows 0-15
- Blue (0.11) in rows 16-24
- Light blue/orange gradient in rows 25-35
3. **attn. v Column**:
- Blue (0.11) in rows 0-12
- Orange (0.13) in rows 13-21
- Light blue (0.12) in rows 22-35
4. **attn. o Column**:
- Light blue (0.12) in rows 0-18
- Orange (0.13) in rows 19-27
- Blue (0.11) in rows 28-35
5. **mlp. up Column**:
- Orange (0.13) in rows 0-9
- Light blue (0.12) in rows 10-24
- Blue (0.11) in rows 25-35
6. **mlp. down Column**:
- Blue (0.11) in rows 0-6
- Orange (0.13) in rows 7-18
- Light blue (0.12) in rows 19-35
7. **mlp. gate Column**:
- Gradient from blue (0.11) at row 0 to orange (0.13) at row 35
- Steepest gradient in rows 15-25 (transition from 0.12 to 0.13)
### Key Observations
- **Attention Mechanisms**:
- "attn. q" shows strongest values (0.13) in middle rows (15-25)
- "attn. o" exhibits a U-shaped pattern with peak values in middle rows
- **MLP Components**:
- "mlp. gate" demonstrates a linear gradient across all rows
- "mlp. down" has the most pronounced mid-range values (rows 7-18)
- **Color Consistency**: All orange regions correspond to 0.13, blue to 0.11, with white/light blue as intermediates
### Interpretation
This heatmap likely represents attention weights or MLP gate activations in a transformer-based neural network. The attention mechanisms show distinct activation patterns:
- "attn. q" and "attn. o" suggest dynamic focus across different input positions
- The MLP components reveal structured value distributions:
- "mlp. gate" gradient may indicate progressive activation scaling
- "mlp. down" mid-range dominance suggests balanced processing
The color-coded values (0.11-0.13) imply relatively small magnitude differences, possibly normalized or scaled for visualization. The row labels (0-35) might correspond to input positions, hidden layer dimensions, or batch indices depending on the model architecture.