## Line Chart: Accuracy vs. Model Size
### Overview
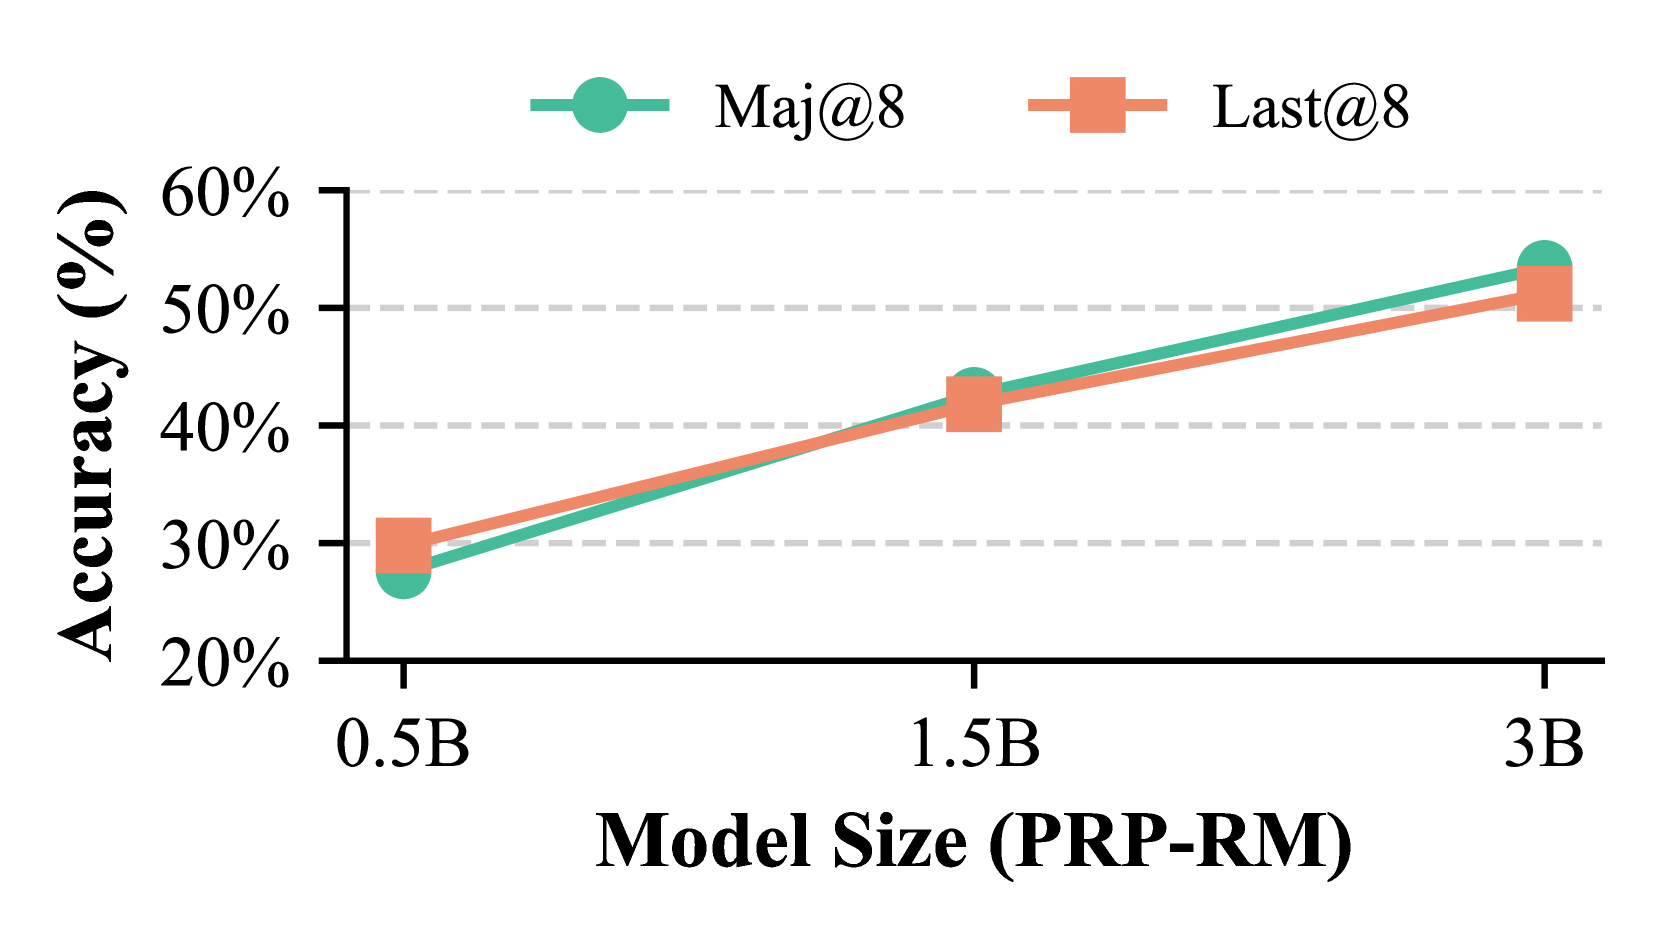
The image is a line chart comparing the accuracy of two methods, "Maj@8" and "Last@8", across different model sizes (0.5B, 1.5B, and 3B). The chart shows how accuracy increases with model size for both methods.
### Components/Axes
* **X-axis:** Model Size (PRP-RM), with markers at 0.5B, 1.5B, and 3B.
* **Y-axis:** Accuracy (%), with markers at 20%, 30%, 40%, 50%, and 60%.
* **Legend:** Located at the top of the chart.
* **Maj@8:** Represented by a teal line with circle markers.
* **Last@8:** Represented by a peach/orange line with square markers.
### Detailed Analysis
* **Maj@8 (Teal Line):** The accuracy generally increases as the model size increases.
* At 0.5B, the accuracy is approximately 27%.
* At 1.5B, the accuracy is approximately 42%.
* At 3B, the accuracy is approximately 54%.
* **Last@8 (Peach/Orange Line):** The accuracy also increases as the model size increases.
* At 0.5B, the accuracy is approximately 31%.
* At 1.5B, the accuracy is approximately 43%.
* At 3B, the accuracy is approximately 51%.
### Key Observations
* Both methods show a positive correlation between model size and accuracy.
* The "Maj@8" method has slightly higher accuracy than the "Last@8" method at the 3B model size.
* The increase in accuracy is more pronounced between 0.5B and 1.5B than between 1.5B and 3B for both methods.
### Interpretation
The chart suggests that increasing the model size (PRP-RM) generally improves the accuracy of both "Maj@8" and "Last@8" methods. However, the rate of improvement appears to diminish as the model size increases further. The "Maj@8" method seems to perform slightly better than the "Last@8" method at larger model sizes. This information is valuable for determining the optimal model size for a given accuracy target and for comparing the effectiveness of different methods.