## Line Chart: Accuracy vs. Model Size
### Overview
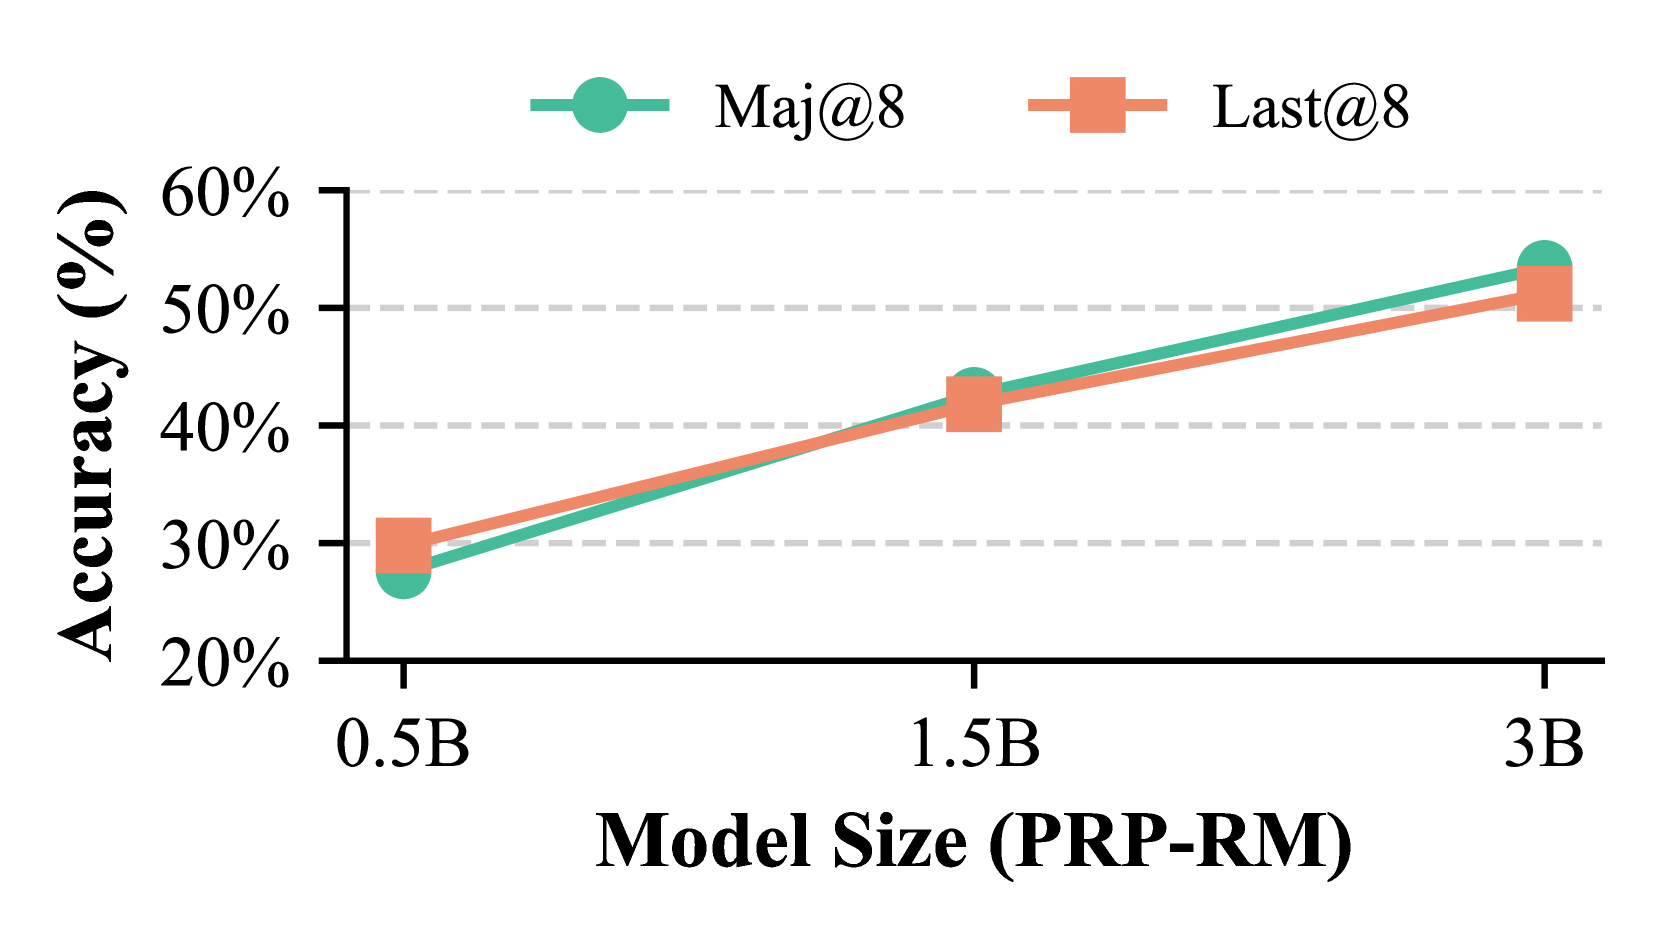
This image displays a line chart illustrating the relationship between "Model Size (PRP-RM)" on the x-axis and "Accuracy (%)" on the y-axis. Two data series, "Maj@8" and "Last@8", are plotted, showing how their accuracy changes with increasing model size.
### Components/Axes
* **X-axis Title:** Model Size (PRP-RM)
* **X-axis Markers:** 0.5B, 1.5B, 3B
* **Y-axis Title:** Accuracy (%)
* **Y-axis Markers:** 20%, 30%, 40%, 50%, 60%
* **Legend:** Located in the top-center of the chart.
* **Maj@8:** Represented by a teal circle marker and a teal line.
* **Last@8:** Represented by an orange square marker and an orange line.
### Detailed Analysis
**Data Series: Maj@8 (Teal Line with Circle Markers)**
* **Trend:** The "Maj@8" data series shows a consistent upward trend in accuracy as the model size increases.
* **Data Points:**
* At 0.5B model size, the accuracy is approximately 27%.
* At 1.5B model size, the accuracy is approximately 42%.
* At 3B model size, the accuracy is approximately 54%.
**Data Series: Last@8 (Orange Line with Square Markers)**
* **Trend:** The "Last@8" data series also exhibits a consistent upward trend in accuracy with increasing model size, closely mirroring the "Maj@8" series.
* **Data Points:**
* At 0.5B model size, the accuracy is approximately 30%.
* At 1.5B model size, the accuracy is approximately 41%.
* At 3B model size, the accuracy is approximately 51%.
### Key Observations
* Both "Maj@8" and "Last@8" demonstrate a positive correlation between model size and accuracy. As the model size increases from 0.5B to 3B, the accuracy for both metrics improves.
* The "Last@8" metric starts with a slightly higher accuracy at 0.5B model size (approximately 30%) compared to "Maj@8" (approximately 27%).
* As the model size increases to 1.5B, the accuracies become very close, with "Maj@8" at approximately 42% and "Last@8" at approximately 41%.
* At the largest model size of 3B, "Maj@8" achieves a slightly higher accuracy (approximately 54%) than "Last@8" (approximately 51%).
* The gap between "Maj@8" and "Last@8" narrows between 0.5B and 1.5B and then widens slightly in favor of "Maj@8" at 3B.
### Interpretation
The chart suggests that for the evaluated metrics ("Maj@8" and "Last@8"), increasing the model size (PRP-RM) generally leads to improved accuracy. This is a common observation in machine learning, where larger models often have a greater capacity to learn complex patterns.
The initial observation that "Last@8" performs slightly better at the smallest model size (0.5B) might indicate that this metric is more sensitive to initial learning or that the smaller model is better suited for the "Last@8" evaluation criteria at this scale. However, as the model size grows, "Maj@8" appears to gain an advantage, particularly at the 3B scale, suggesting it scales more effectively or benefits more from larger model capacities. The close performance between the two metrics at 1.5B indicates a point where their performance is nearly equivalent.
The data demonstrates a trade-off or differing scaling properties between the "Maj@8" and "Last@8" metrics as model size increases. Further investigation could explore why "Maj@8" shows superior performance at larger scales and what specific aspects of the model architecture or training process contribute to this difference. The consistent upward trend for both metrics validates the general principle of model scaling for performance improvement within the tested range.