## Line Chart: Model Size vs Accuracy Comparison
### Overview
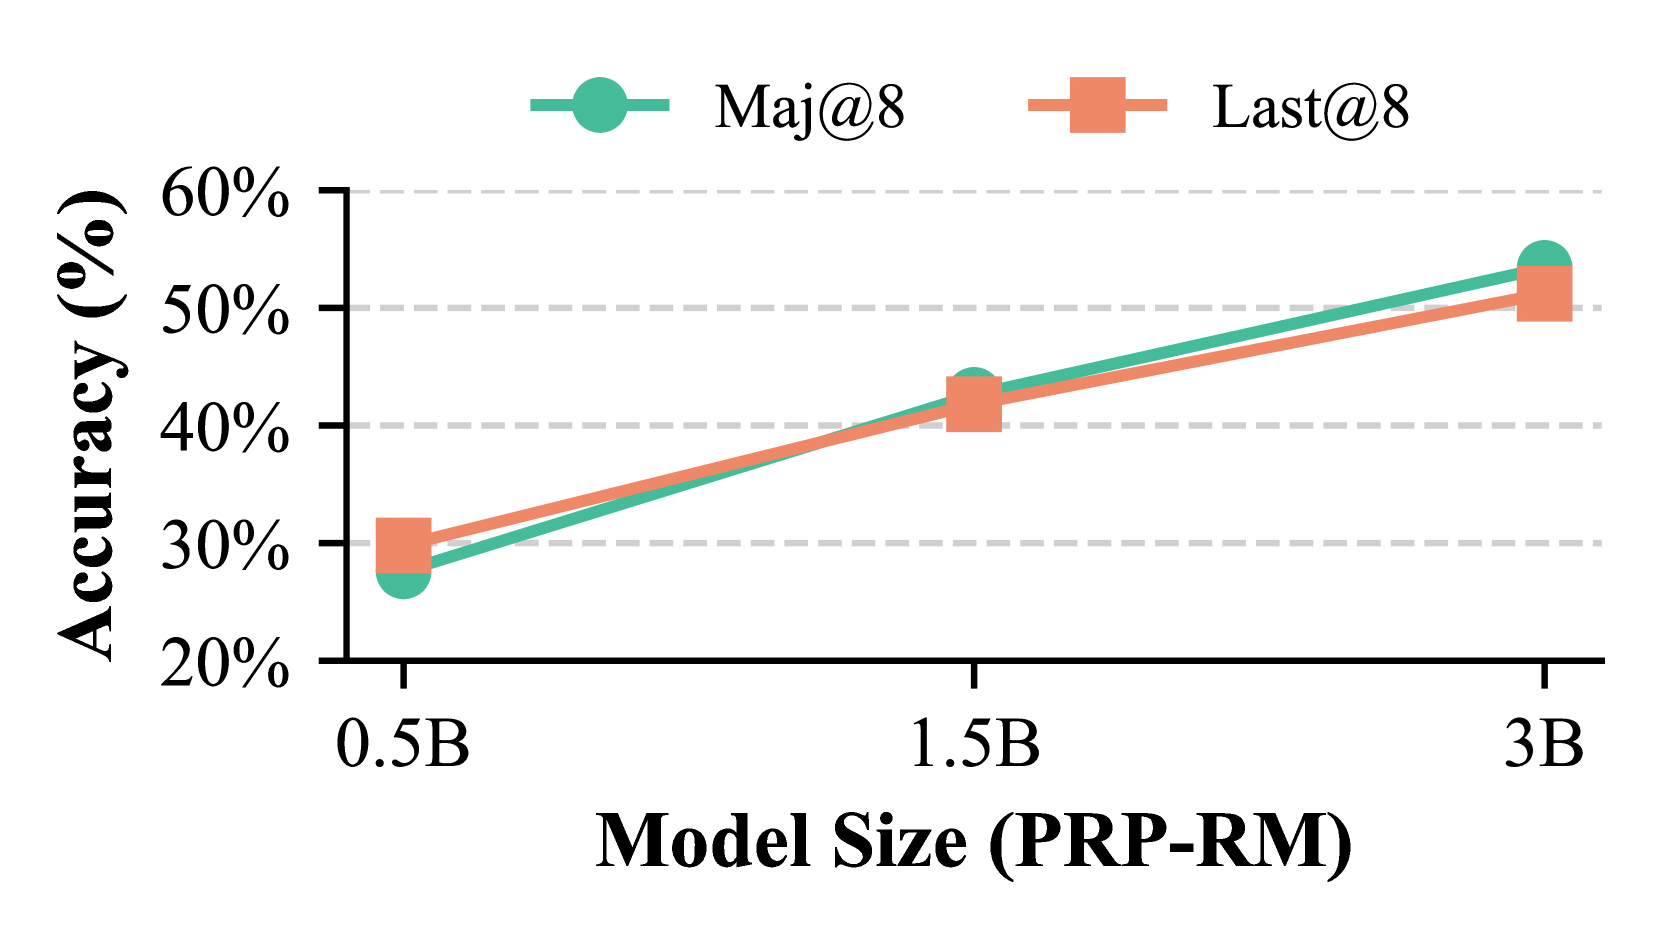
The chart compares the accuracy of two metrics ("Maj@8" and "Last@8") across three model sizes (0.5B, 1.5B, 3B) in PRP-RM. Both metrics show increasing accuracy with larger model sizes, but "Maj@8" consistently outperforms "Last@8" at larger scales.
### Components/Axes
- **X-axis**: Model Size (PRP-RM) with discrete markers at 0.5B, 1.5B, and 3B.
- **Y-axis**: Accuracy (%) ranging from 20% to 60% in 10% increments.
- **Legend**:
- Green circles with connecting lines represent "Maj@8".
- Orange squares with connecting lines represent "Last@8".
- **Gridlines**: Dashed horizontal lines at 20%, 30%, 40%, 50%, and 60%.
### Detailed Analysis
1. **Model Size 0.5B**:
- Maj@8: ~27% accuracy (green circle).
- Last@8: ~30% accuracy (orange square).
2. **Model Size 1.5B**:
- Maj@8: ~44% accuracy (green circle).
- Last@8: ~42% accuracy (orange square).
3. **Model Size 3B**:
- Maj@8: ~55% accuracy (green circle).
- Last@8: ~52% accuracy (orange square).
### Key Observations
- Both metrics show a positive correlation between model size and accuracy.
- "Maj@8" outperforms "Last@8" at 1.5B and 3B model sizes.
- The accuracy gap between the two metrics widens as model size increases.
- At 0.5B, "Last@8" has a slight edge (~3% higher accuracy).
### Interpretation
The data suggests that larger models improve performance for both metrics, but "Maj@8" scales more effectively. This could indicate that "Maj@8" is better optimized for larger architectures or captures more nuanced patterns in the data. The divergence at 3B highlights potential architectural or algorithmic advantages in "Maj@8". The initial parity at 0.5B implies that smaller models may benefit more from "Last@8" optimizations, possibly due to simpler decision boundaries or reduced computational overhead.