## Chart: Loss vs Model and Dataset Size & Loss vs Model Size and Training Steps
### Overview
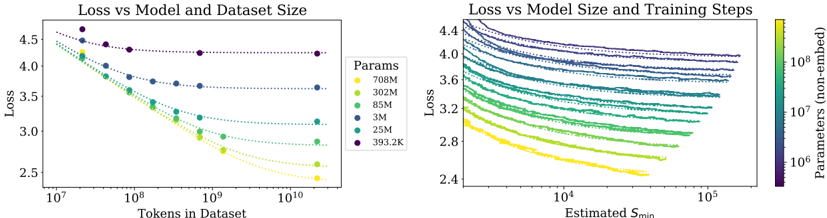
The image presents two scatter plots side-by-side, both examining the relationship between 'Loss' and other variables. The left plot explores 'Loss' in relation to 'Tokens in Dataset' for different model sizes ('Params'). The right plot explores 'Loss' in relation to 'Estimated Smin' (training steps) for different model sizes ('Params'). The model sizes are color-coded in both plots, allowing for comparison.
### Components/Axes
**Left Plot:**
* **Title:** Loss vs Model and Dataset Size
* **Y-axis:** Loss (linear scale, values ranging from approximately 2.5 to 4.5)
* **X-axis:** Tokens in Dataset (logarithmic scale, values ranging from 10^7 to 10^10)
* **Legend (Params):** Located on the right side of the left plot.
* Yellow: 708M
* Light Green: 302M
* Green: 85M
* Blue: 3M
* Dark Blue: 25M
* Purple: 393.2K
**Right Plot:**
* **Title:** Loss vs Model Size and Training Steps
* **Y-axis:** Loss (linear scale, values ranging from approximately 2.4 to 4.4)
* **X-axis:** Estimated Smin (logarithmic scale, values ranging from 10^4 to 10^5)
* **Secondary Y-axis:** Parameters (non-embed) (logarithmic scale, values ranging from 10^6 to 10^8). This axis is represented by a color gradient.
* **Color Gradient Legend:** Located on the right side of the right plot. The color gradient maps to the "Parameters (non-embed)" values. Yellow represents lower parameter values, and purple represents higher parameter values.
### Detailed Analysis
**Left Plot: Loss vs Model and Dataset Size**
* **708M (Yellow):** The loss decreases from approximately 4.3 at 10^7 tokens to approximately 2.7 at 10^10 tokens.
* **302M (Light Green):** The loss decreases from approximately 4.1 at 10^7 tokens to approximately 2.9 at 10^10 tokens.
* **85M (Green):** The loss decreases from approximately 3.9 at 10^7 tokens to approximately 3.1 at 10^10 tokens.
* **3M (Blue):** The loss decreases from approximately 3.7 at 10^7 tokens to approximately 3.3 at 10^10 tokens.
* **25M (Dark Blue):** The loss decreases from approximately 4.2 at 10^7 tokens to approximately 3.6 at 10^10 tokens.
* **393.2K (Purple):** The loss remains relatively constant, starting at approximately 4.6 at 10^7 tokens and ending at approximately 4.3 at 10^10 tokens.
**Trend Verification (Left Plot):** All data series, except for the 393.2K series, show a decreasing trend in loss as the number of tokens in the dataset increases. The 393.2K series remains relatively flat.
**Right Plot: Loss vs Model Size and Training Steps**
* The data series are color-coded based on the "Parameters (non-embed)" values, ranging from yellow (lower values) to purple (higher values).
* All data series show a decreasing trend in loss as the estimated Smin (training steps) increases.
* The series with higher parameter values (purple) generally have higher loss values across the range of estimated Smin.
* The series with lower parameter values (yellow) generally have lower loss values across the range of estimated Smin.
**Trend Verification (Right Plot):** All data series show a decreasing trend in loss as the estimated Smin increases.
### Key Observations
* In the left plot, larger models (higher 'Params' values) generally exhibit lower loss for a given number of tokens in the dataset, except for the 393.2K model.
* In the right plot, increasing the estimated Smin (training steps) generally leads to a decrease in loss for all model sizes.
* The right plot shows a clear correlation between the number of parameters and the loss, with larger models generally having higher loss values.
### Interpretation
The plots suggest that increasing both the dataset size (number of tokens) and the number of training steps (estimated Smin) can lead to a reduction in loss. However, the relationship between model size ('Params') and loss is more complex. In the left plot, larger models generally perform better (lower loss) with increasing dataset size. In the right plot, larger models tend to have higher loss values, which could be due to factors such as overfitting or the need for more extensive training. The 393.2K model in the left plot is an outlier, as it does not show a significant decrease in loss with increasing dataset size, suggesting that it may be under-parameterized for the task. The color gradient in the right plot provides a visual representation of how the number of parameters affects the loss, with larger models (purple) generally having higher loss values.