## Line Charts: Loss vs Model/Dataset Size and Loss vs Model Size/Training Steps
### Overview
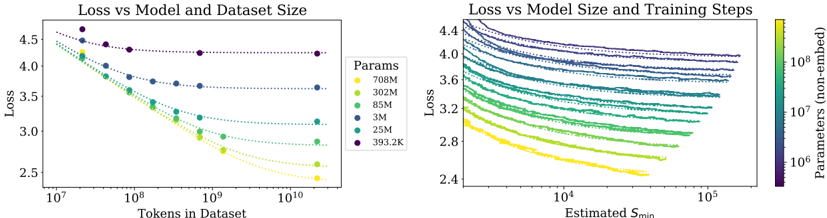
The image contains two side-by-side line charts analyzing the relationship between model performance (measured as loss) and two key variables: dataset size and training steps. The left chart examines how loss decreases with increasing dataset size for models of varying parameter counts. The right chart explores how loss decreases with increasing training steps (Estimated S_min) for models of different parameter sizes, visualized through a color gradient.
### Components/Axes
**Left Chart: Loss vs Model and Dataset Size**
- **X-axis**: Tokens in Dataset (log scale, 10⁷ to 10¹⁰)
- **Y-axis**: Loss (linear scale, 2.4 to 4.5)
- **Legend**:
- Yellow: 708M parameters
- Green: 302M parameters
- Teal: 85M parameters
- Blue: 3M parameters
- Dark Blue: 25M parameters
- Purple: 393.2K parameters
- **Line Styles**: Dotted lines for all series; markers (dots) at data points.
**Right Chart: Loss vs Model Size and Training Steps**
- **X-axis**: Estimated S_min (log scale, 10⁴ to 10⁵)
- **Y-axis**: Loss (linear scale, 2.4 to 4.4)
- **Color Gradient Legend**:
- Yellow (10⁸ parameters) to Purple (10⁶ parameters)
- **Line Styles**: Solid lines without markers; grouped by parameter size via color.
### Detailed Analysis
**Left Chart Trends**:
- All lines show a downward trend: loss decreases as dataset size increases.
- Larger models (e.g., 708M, 302M) start with higher loss but achieve lower final loss at larger dataset sizes.
- Smaller models (e.g., 393.2K) maintain higher loss across all dataset sizes but show gradual improvement.
- Example: At 10¹⁰ tokens, 708M parameters achieve ~2.7 loss, while 393.2K parameters reach ~3.1 loss.
**Right Chart Trends**:
- All lines slope downward: loss decreases as S_min increases.
- Higher-parameter models (yellow) consistently achieve lower loss across all S_min values.
- Diminishing returns observed: the steepest loss reduction occurs at lower S_min values (e.g., 10⁴ to 10⁵), with flattening trends at higher S_min.
- Example: For 10⁸ parameters (yellow), loss drops from ~3.6 at S_min=10⁴ to ~2.8 at S_min=10⁵.
### Key Observations
1. **Dataset Size Impact**: Larger models benefit more from increased dataset size, achieving lower loss at scale.
2. **Training Steps Impact**: Higher S_min reduces loss, but the effect plateaus for all models, with smaller models showing less improvement.
3. **Parameter-Size Correlation**: Models with more parameters (yellow) outperform smaller models (purple) across both dataset size and training steps.
4. **Diminishing Returns**: Both charts show that gains in performance (loss reduction) slow as variables (tokens/S_min) increase.
### Interpretation
The data suggests that model performance (lower loss) is strongly influenced by both dataset size and training steps, with larger models leveraging these resources more effectively. The left chart emphasizes the importance of scaling datasets for complex models, while the right chart highlights the value of extended training, particularly for high-parameter models. However, the diminishing returns in the right chart imply that beyond a certain point, additional training steps yield minimal benefits, especially for smaller models. This underscores a trade-off: investing in larger models or datasets may be more impactful than prolonging training for smaller architectures. The color gradient in the right chart visually reinforces the parameter-size hierarchy, making it easier to compare performance across models.