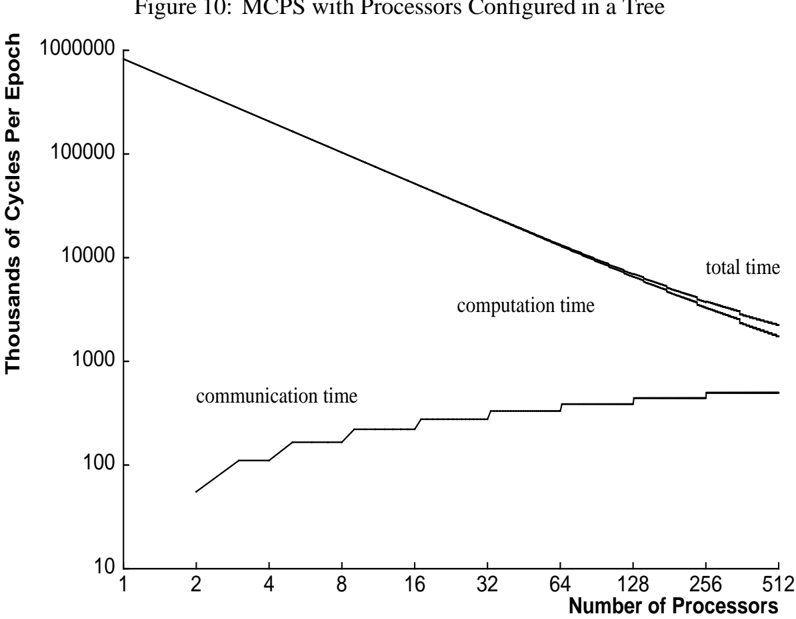
## Chart: MCPS with Processors Configured in a Tree
### Overview
The image is a line chart comparing the "total time", "computation time", and "communication time" in thousands of cycles per epoch against the number of processors, ranging from 1 to 512. The y-axis is logarithmic, spanning from 10 to 1,000,000.
### Components/Axes
* **Title:** Figure 10: MCPS with Processors Configured in a Tree
* **X-axis:** Number of Processors (1, 2, 4, 8, 16, 32, 64, 128, 256, 512)
* **Y-axis:** Thousands of Cycles Per Epoch (10, 100, 1000, 10000, 100000, 1000000)
* **Data Series:**
* Total Time (Black): Decreases as the number of processors increases.
* Computation Time (Black): Decreases as the number of processors increases, but at a slower rate than total time.
* Communication Time (Black): Increases as the number of processors increases, but the rate of increase slows down as the number of processors increases.
### Detailed Analysis
* **Total Time:**
* At 1 processor: Approximately 800,000 cycles per epoch.
* At 512 processors: Approximately 2,000 cycles per epoch.
* Trend: Decreases sharply initially, then the rate of decrease slows down.
* **Computation Time:**
* At 1 processor: Approximately 80,000 cycles per epoch.
* At 512 processors: Approximately 1,500 cycles per epoch.
* Trend: Decreases as the number of processors increases.
* **Communication Time:**
* At 2 processors: Approximately 40 cycles per epoch.
* At 512 processors: Approximately 400 cycles per epoch.
* Trend: Increases in a step-wise fashion as the number of processors increases. The rate of increase slows down as the number of processors increases.
### Key Observations
* Total time decreases significantly with an increasing number of processors.
* Computation time also decreases with an increasing number of processors, but not as drastically as total time.
* Communication time increases with an increasing number of processors.
* At a low number of processors, total time is significantly higher than computation and communication time.
* At a high number of processors, the difference between total time and computation time decreases, while communication time becomes a more significant factor.
### Interpretation
The chart illustrates the trade-offs involved in parallel processing using a tree configuration. As the number of processors increases, the total time and computation time decrease, suggesting that the workload is being distributed more efficiently. However, the communication time increases, indicating that more processors require more communication overhead.
The data suggests that there is a point of diminishing returns. Initially, adding more processors significantly reduces the total time. However, as the number of processors continues to increase, the reduction in total time becomes smaller, while the communication overhead becomes more significant. This implies that there is an optimal number of processors for this particular configuration, beyond which the benefits of parallel processing are outweighed by the cost of communication.
The chart highlights the importance of considering both computation and communication costs when designing parallel algorithms. While increasing the number of processors can improve performance, it is crucial to minimize communication overhead to achieve optimal results.