\n
## Line Chart: MCPS with Processors Configured in a Tree
### Overview
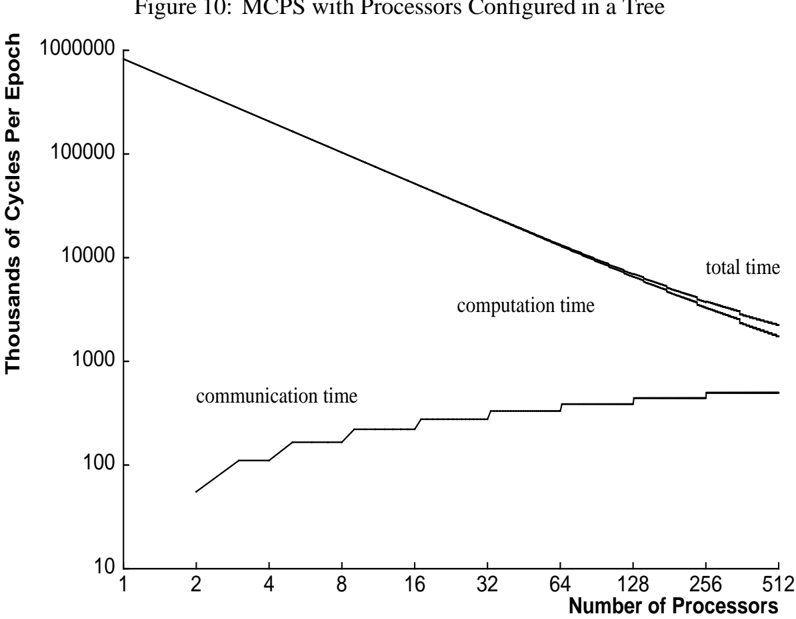
The image presents a line chart illustrating the relationship between the number of processors and the cycles per epoch for computation time, communication time, and total time. The chart is titled "Figure 10: MCPS with Processors Configured in a Tree". The y-axis represents "Thousands of Cycles Per Epoch" on a logarithmic scale, while the x-axis represents "Number of Processors" on a linear scale.
### Components/Axes
* **Title:** Figure 10: MCPS with Processors Configured in a Tree
* **X-axis Label:** Number of Processors
* **X-axis Scale:** Linear, ranging from 1 to 512. Marked at 1, 2, 4, 8, 16, 32, 64, 128, 256, and 512.
* **Y-axis Label:** Thousands of Cycles Per Epoch
* **Y-axis Scale:** Logarithmic, ranging from 10 to 100000. Marked at 10, 100, 1000, 10000, 100000.
* **Data Series:**
* Total Time (Dark Grey Line)
* Computation Time (Light Grey Line)
* Communication Time (Black Line)
### Detailed Analysis
The chart displays three lines representing the trends of total time, computation time, and communication time as the number of processors increases.
* **Total Time (Dark Grey):** The line starts at approximately 95,000 cycles per epoch with 1 processor. It slopes downward, becoming increasingly shallow as the number of processors increases. At 512 processors, the total time is approximately 2,500 cycles per epoch.
* **Computation Time (Light Grey):** The line begins at approximately 90,000 cycles per epoch with 1 processor. It decreases rapidly initially, then levels off. At 512 processors, the computation time is approximately 2,000 cycles per epoch.
* **Communication Time (Black):** The line starts at approximately 20 cycles per epoch with 1 processor. It increases in steps, remaining relatively flat between steps. There is a noticeable step increase around 4 processors, reaching approximately 80 cycles per epoch. Another step increase occurs around 64 processors, reaching approximately 200 cycles per epoch. At 512 processors, the communication time is approximately 250 cycles per epoch.
### Key Observations
* As the number of processors increases, the total time and computation time decrease, while the communication time increases.
* The communication time exhibits a step-wise increase, suggesting that the communication overhead increases at certain processor counts.
* The computation time dominates the total time for a small number of processors, but as the number of processors increases, the communication time becomes a more significant contributor to the total time.
* The rate of decrease in computation time slows down as the number of processors increases.
### Interpretation
The data suggests that while increasing the number of processors initially reduces the computation time and overall processing time, the communication overhead eventually becomes a limiting factor. The step-wise increases in communication time likely correspond to the need for more complex communication patterns as the number of processors grows. This indicates that there is an optimal number of processors beyond which adding more processors does not significantly improve performance and may even degrade it due to increased communication overhead. The logarithmic scale on the y-axis emphasizes the dramatic reduction in cycles per epoch for both total and computation time with increasing processors, but also highlights the relatively smaller, yet significant, increase in communication time. This chart is likely demonstrating the trade-offs involved in parallel processing, where the benefits of increased computation power must be weighed against the costs of increased communication complexity.