## Line Chart: MCPS with Processors Configured in a Tree
### Overview
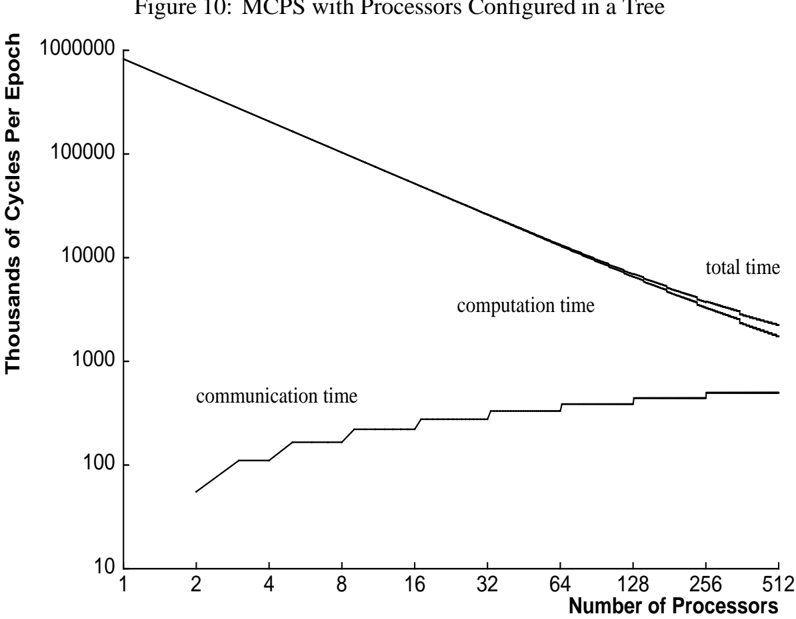
The image is a logarithmic line chart titled "MCPS with Processors Configured in a Tree." It illustrates the relationship between the number of processors and two time metrics: "total time" and "computation time," measured in "Thousands of Cycles Per Epoch." The x-axis represents the number of processors (ranging from 1 to 512), while the y-axis represents time in logarithmic scale (10 to 1,000,000). A third label, "communication time," is present but not visually represented as a line.
### Components/Axes
- **Y-axis**: "Thousands of Cycles Per Epoch" (logarithmic scale: 10, 100, 1,000, 10,000, 100,000, 1,000,000).
- **X-axis**: "Number of Processors" (linear scale: 1, 2, 4, 8, 16, 32, 64, 128, 256, 512).
- **Legend**: Located on the right side of the chart.
- **Line 1**: "total time" (solid line, dark gray).
- **Line 2**: "computation time" (dashed line, light gray).
- **Label**: "communication time" (text annotation, no corresponding line).
### Detailed Analysis
- **Total Time**:
- Starts at **1,000,000 cycles** for 1 processor.
- Decreases linearly as the number of processors increases.
- At 512 processors, the total time is approximately **10,000 cycles**.
- The line shows a consistent downward trend, indicating improved performance with more processors.
- **Computation Time**:
- Starts at **100 cycles** for 1 processor.
- Increases slightly as the number of processors increases.
- At 512 processors, the computation time is approximately **1,000 cycles**.
- The line shows a gradual upward trend, suggesting that computation time per processor increases with more processors.
- **Communication Time**:
- Labeled as "communication time" in the image but **no corresponding line** is visible.
- Likely represents a separate metric not plotted in the chart.
### Key Observations
1. **Total Time Decreases with More Processors**: The "total time" line shows a clear inverse relationship between the number of processors and time, consistent with parallel computing principles.
2. **Computation Time Increases Slightly**: The "computation time" line rises gradually, indicating that individual processors may handle more work as the system scales, but this is offset by the reduction in total time.
3. **Missing Communication Time Line**: The "communication time" label is present but not visualized, suggesting either a missing data series or a mislabeling.
### Interpretation
The chart demonstrates that increasing the number of processors reduces the **total time** required for the MCPS (Message-Level Communication Protocol Stack) to complete an epoch, as expected in parallel systems. However, the **computation time** per processor increases slightly, which may reflect overhead from coordination or load balancing. The absence of a "communication time" line raises questions about how communication overhead is accounted for in the total time. This could imply that communication is either negligible, embedded within the total time, or not explicitly modeled in this visualization. The data highlights the trade-off between parallelization gains and per-processor computational costs, a critical consideration in distributed computing systems.