## Chart Type: Multiple Line Charts
### Overview
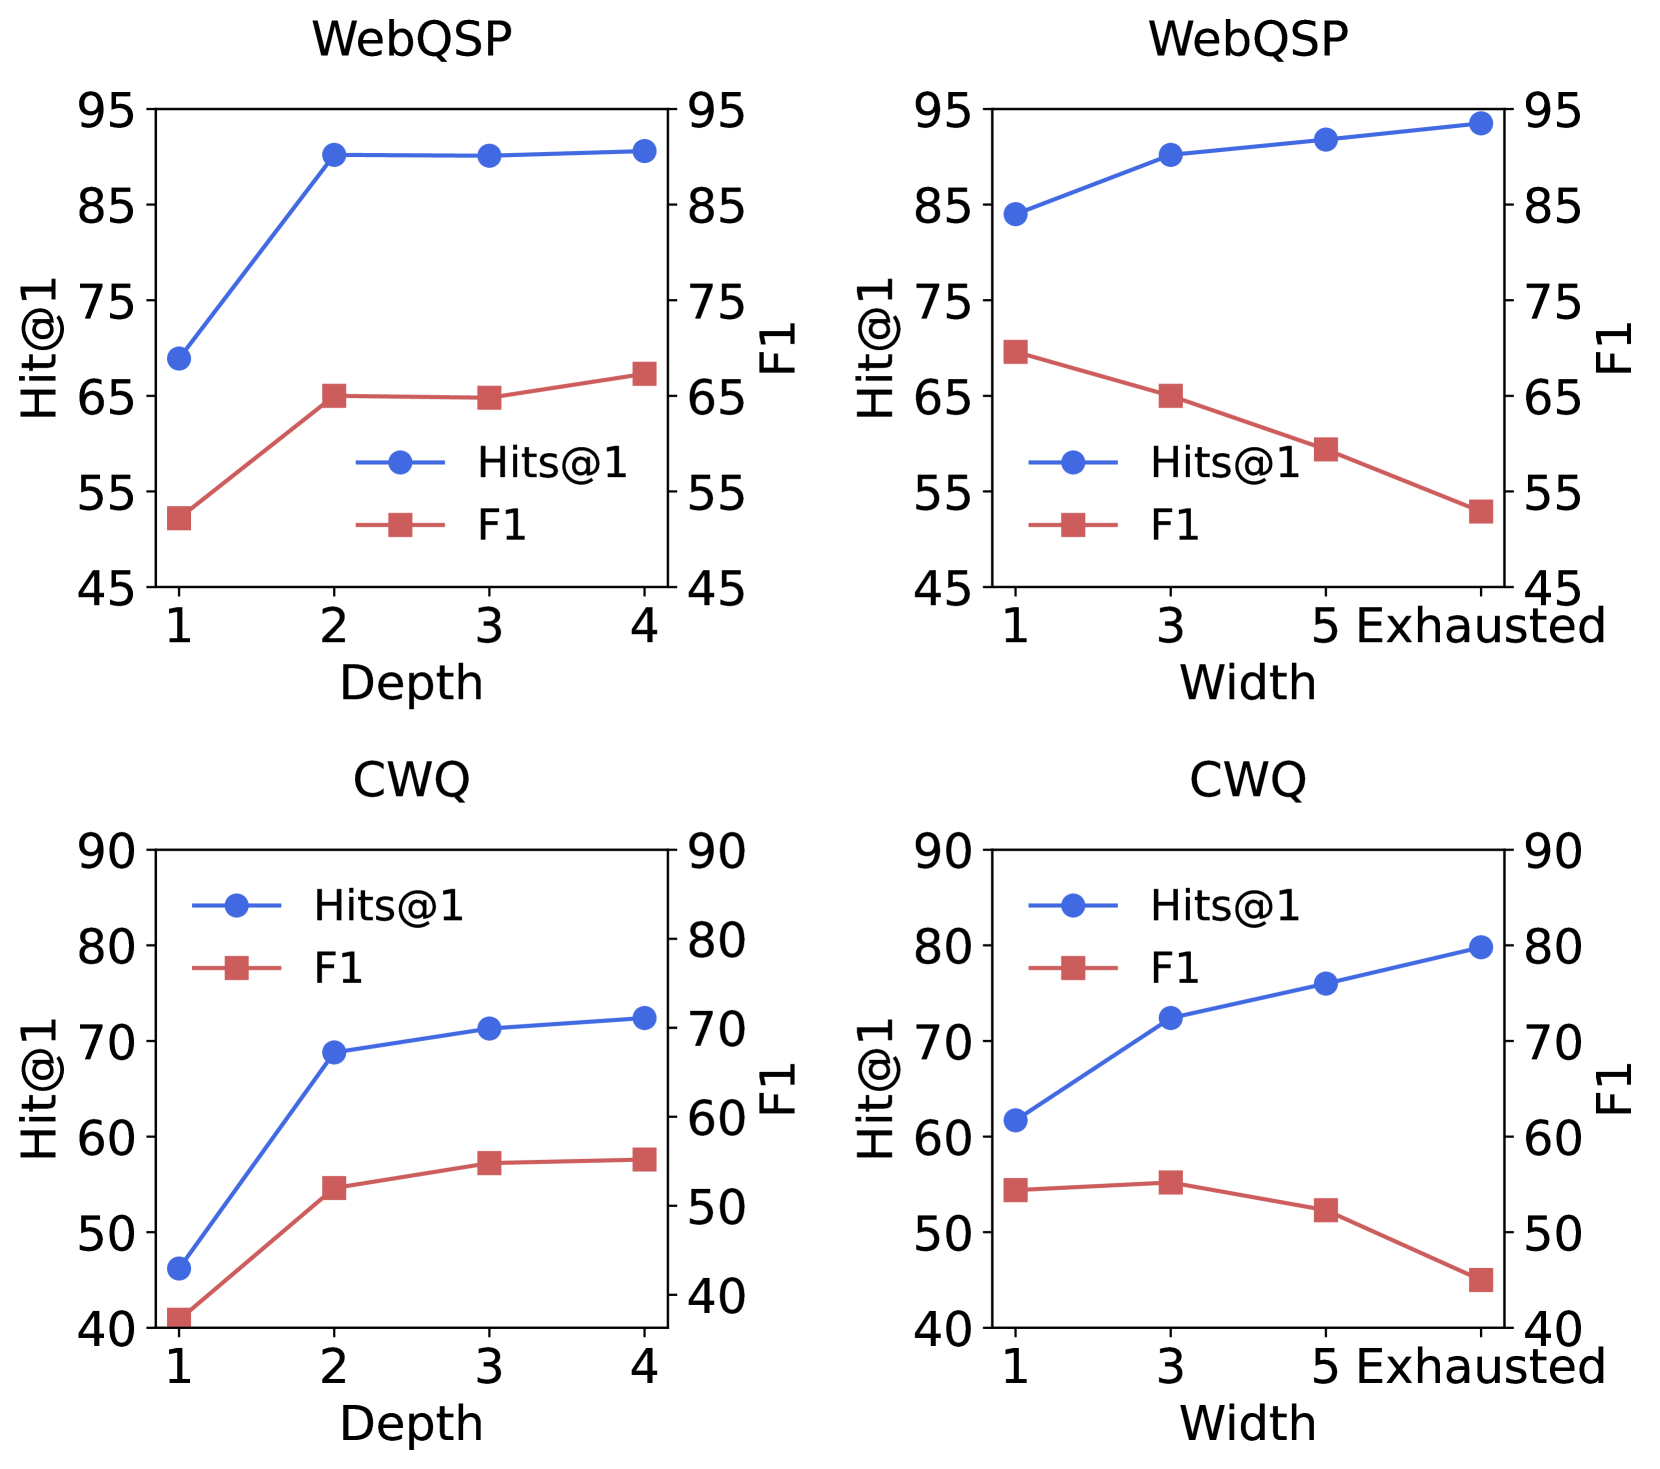
The image contains four line charts arranged in a 2x2 grid. Each chart plots two data series: "Hits@1" and "F1", against either "Depth" or "Width". The charts are titled "WebQSP" (top row) and "CWQ" (bottom row). The x-axis represents "Depth" for the left column and "Width" for the right column. The y-axis on the left represents "Hit@1" and the y-axis on the right represents "F1".
### Components/Axes
* **Titles:**
* Top-Left: WebQSP
* Top-Right: WebQSP
* Bottom-Left: CWQ
* Bottom-Right: CWQ
* **X-Axes:**
* Top-Left: Depth (values: 1, 2, 3, 4)
* Top-Right: Width (values: 1, 3, 5 Exhausted)
* Bottom-Left: Depth (values: 1, 2, 3, 4)
* Bottom-Right: Width (values: 1, 3, 5 Exhausted)
* **Y-Axes (Left):** Hit@1 (values ranging from 45 to 95 in the top row, and 40 to 90 in the bottom row)
* **Y-Axes (Right):** F1 (values ranging from 45 to 95 in the top row, and 40 to 90 in the bottom row)
* **Legend:**
* Blue line with circle markers: Hits@1
* Red line with square markers: F1
### Detailed Analysis
**1. WebQSP (Depth):**
* **Hits@1 (Blue):** The line slopes sharply upward from approximately 68 at Depth=1 to approximately 88 at Depth=2, then plateaus around 93-94 at Depth=3 and Depth=4.
* Depth 1: ~68
* Depth 2: ~88
* Depth 3: ~93
* Depth 4: ~94
* **F1 (Red):** The line slopes upward from approximately 53 at Depth=1 to approximately 65 at Depth=2, and remains relatively constant at Depth=3 and Depth=4.
* Depth 1: ~53
* Depth 2: ~65
* Depth 3: ~65
* Depth 4: ~67
**2. WebQSP (Width):**
* **Hits@1 (Blue):** The line slopes upward from approximately 84 at Width=1 to approximately 93 at Width=3, then slightly increases to approximately 95 at Width=5.
* Width 1: ~84
* Width 3: ~93
* Width 5: ~95
* **F1 (Red):** The line slopes downward from approximately 69 at Width=1 to approximately 60 at Width=3, then further decreases to approximately 53 at Width=5.
* Width 1: ~69
* Width 3: ~60
* Width 5: ~53
**3. CWQ (Depth):**
* **Hits@1 (Blue):** The line slopes upward from approximately 47 at Depth=1 to approximately 69 at Depth=2, then increases to approximately 72 at Depth=3, and further increases to approximately 73 at Depth=4.
* Depth 1: ~47
* Depth 2: ~69
* Depth 3: ~72
* Depth 4: ~73
* **F1 (Red):** The line slopes upward from approximately 41 at Depth=1 to approximately 55 at Depth=2, then plateaus around 57-58 at Depth=3 and Depth=4.
* Depth 1: ~41
* Depth 2: ~55
* Depth 3: ~57
* Depth 4: ~58
**4. CWQ (Width):**
* **Hits@1 (Blue):** The line slopes upward from approximately 62 at Width=1 to approximately 72 at Width=3, then increases to approximately 76 at Width=5.
* Width 1: ~62
* Width 3: ~72
* Width 5: ~80
* **F1 (Red):** The line slopes downward from approximately 55 at Width=1 to approximately 52 at Width=3, then further decreases to approximately 45 at Width=5.
* Width 1: ~55
* Width 3: ~52
* Width 5: ~45
### Key Observations
* For WebQSP, increasing Depth improves both Hits@1 and F1, but Hits@1 plateaus quickly. Increasing Width improves Hits@1 but degrades F1.
* For CWQ, increasing Depth improves both Hits@1 and F1, but the improvement diminishes with greater depth. Increasing Width improves Hits@1 but degrades F1.
* Hits@1 generally increases with Depth and Width, while F1 shows mixed behavior, increasing with Depth but decreasing with Width.
### Interpretation
The charts compare the performance of two question answering systems (WebQSP and CWQ) under different configurations of "Depth" and "Width". "Hits@1" represents the proportion of questions for which the correct answer is among the top predicted answers. "F1" is a measure of precision and recall, indicating the quality of the answers.
The data suggests that increasing the "Depth" parameter generally improves both the accuracy (Hits@1) and the quality (F1) of the answers, although the gains may diminish at higher depths. In contrast, increasing the "Width" parameter improves accuracy (Hits@1) but degrades the quality of the answers (F1). This could indicate that a wider search space leads to more correct answers being considered, but also introduces more noise or incorrect information, reducing the overall quality of the answers.
The difference in performance between WebQSP and CWQ might be due to the nature of the datasets or the specific algorithms used. WebQSP appears to achieve higher Hits@1 scores than CWQ, suggesting it may be a simpler or more well-suited dataset for these systems.