\n
## Charts: Performance Evaluation of WebQSP and CWQ
### Overview
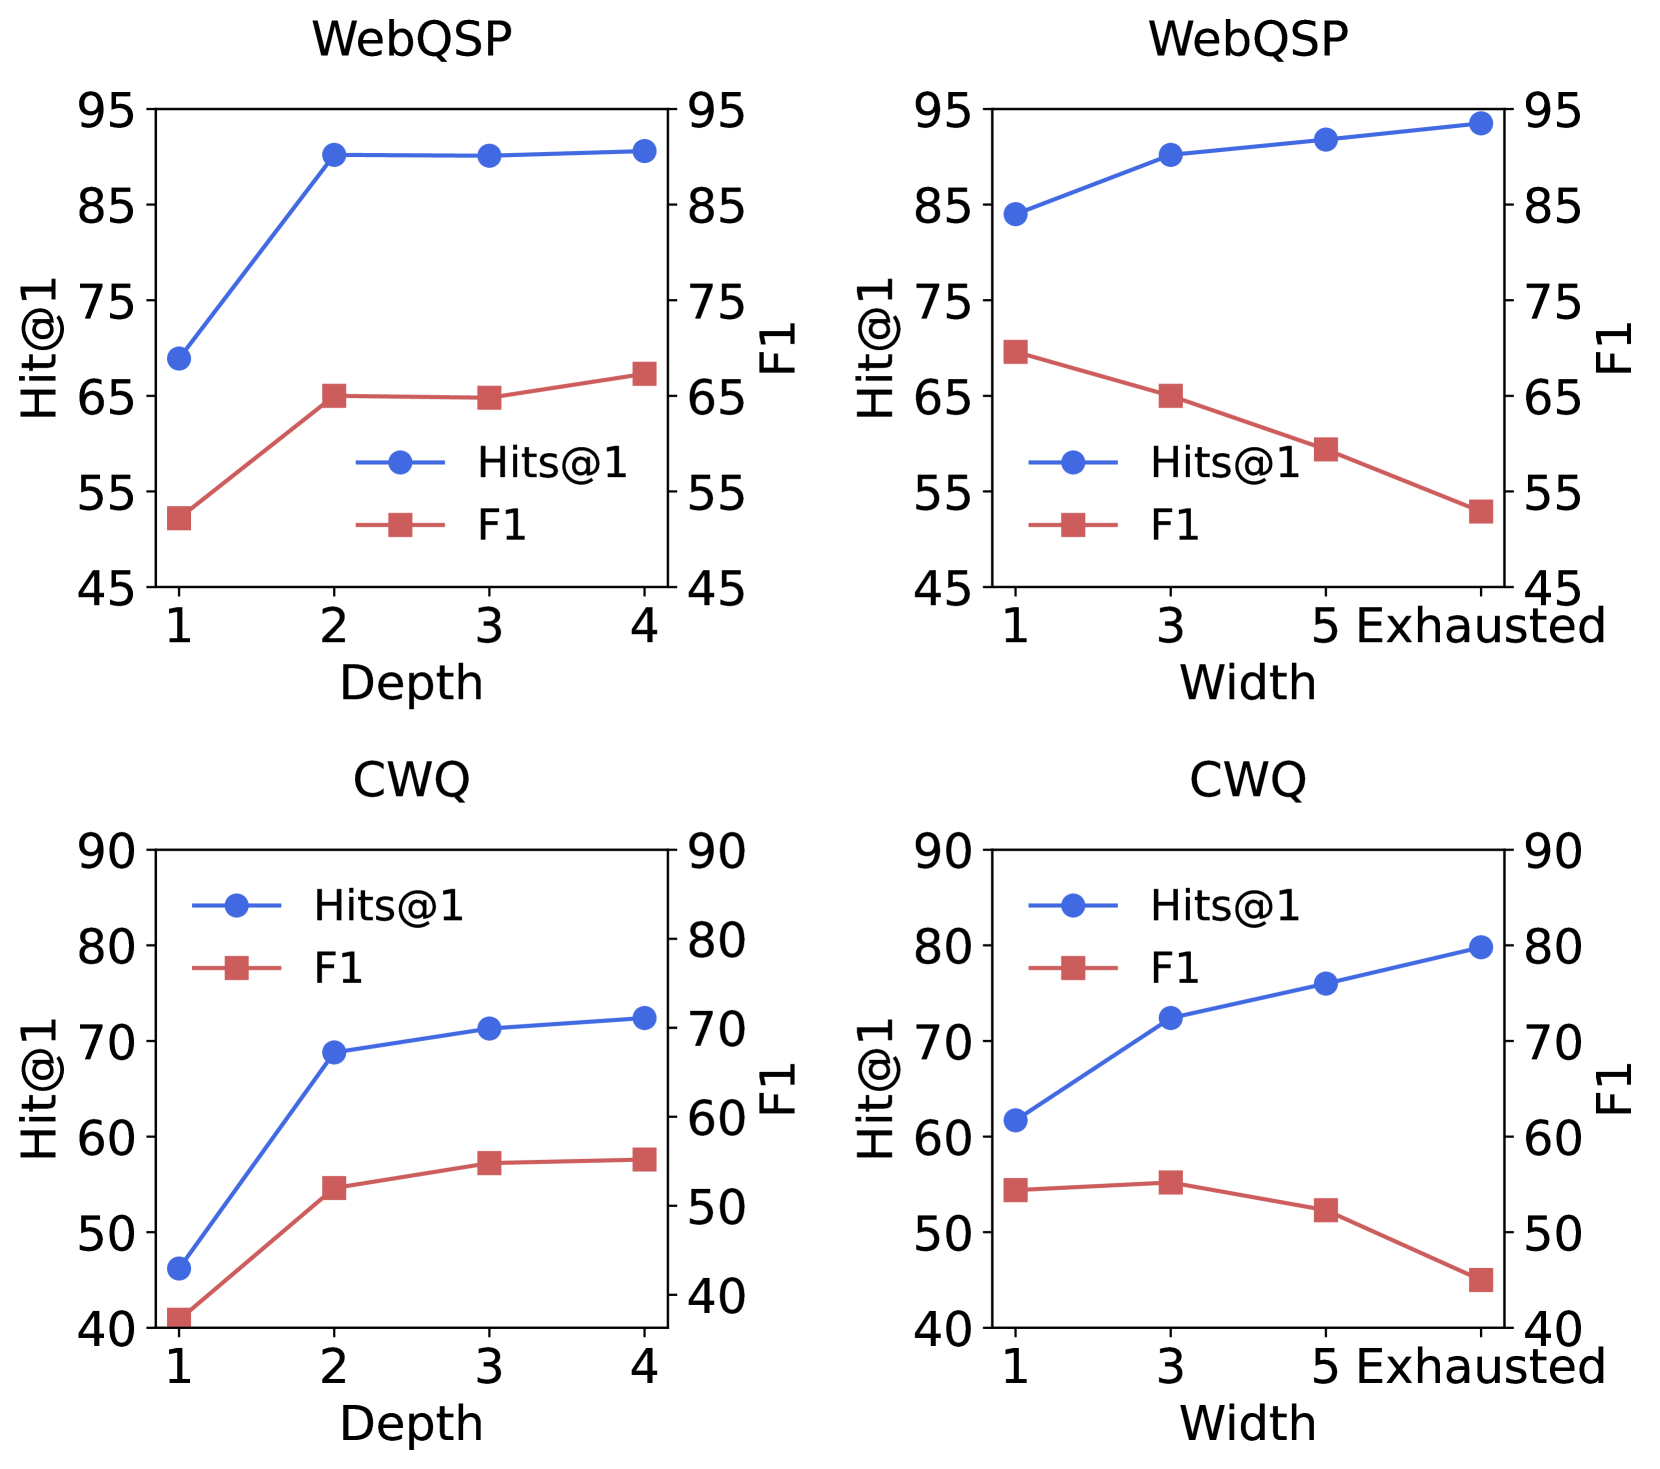
The image contains four line charts displaying the performance of two different models, WebQSP and CWQ, evaluated using two metrics: Hits@1 and F1. Each model's performance is shown across two dimensions: Depth (1 to 4) and Width (1 to Exhausted). The charts aim to illustrate how performance changes with varying depth and width parameters.
### Components/Axes
Each chart shares the following components:
* **Title:** Located at the top-center of each chart, indicating the model being evaluated (WebQSP or CWQ).
* **X-axis:** Represents the independent variable, either "Depth" or "Width".
* Depth: Scale ranges from 1 to 4.
* Width: Scale ranges from 1 to "Exhausted".
* **Y-axis:** Represents the performance metrics, "Hit@1" and "F1".
* Scale ranges from 45 to 95.
* **Legend:** Located in the top-left corner of each chart, identifying the two data series:
* "Hits@1" - Represented by a blue circle marker.
* "F1" - Represented by a red square marker.
### Detailed Analysis or Content Details
**Chart 1: WebQSP - Depth**
* **Hits@1 (Blue Line):** The line slopes upward, indicating increasing performance with increasing depth.
* Depth 1: Approximately 60.
* Depth 2: Approximately 85.
* Depth 3: Approximately 90.
* Depth 4: Approximately 92.
* **F1 (Red Line):** The line initially increases sharply and then plateaus.
* Depth 1: Approximately 50.
* Depth 2: Approximately 65.
* Depth 3: Approximately 70.
* Depth 4: Approximately 72.
**Chart 2: WebQSP - Width**
* **Hits@1 (Blue Line):** The line initially decreases slightly and then plateaus.
* Width 1: Approximately 85.
* Width 3: Approximately 80.
* Width 5: Approximately 82.
* Width Exhausted: Approximately 82.
* **F1 (Red Line):** The line slopes downward, indicating decreasing performance with increasing width.
* Width 1: Approximately 60.
* Width 3: Approximately 55.
* Width 5: Approximately 50.
* Width Exhausted: Approximately 45.
**Chart 3: CWQ - Depth**
* **Hits@1 (Blue Line):** The line increases sharply from Depth 1 to Depth 2, then plateaus.
* Depth 1: Approximately 50.
* Depth 2: Approximately 70.
* Depth 3: Approximately 72.
* Depth 4: Approximately 73.
* **F1 (Red Line):** The line increases sharply from Depth 1 to Depth 2, then plateaus.
* Depth 1: Approximately 45.
* Depth 2: Approximately 60.
* Depth 3: Approximately 65.
* Depth 4: Approximately 66.
**Chart 4: CWQ - Width**
* **Hits@1 (Blue Line):** The line increases sharply from Width 1 to Width 3, then plateaus.
* Width 1: Approximately 70.
* Width 3: Approximately 80.
* Width 5: Approximately 81.
* Width Exhausted: Approximately 81.
* **F1 (Red Line):** The line slopes downward, indicating decreasing performance with increasing width.
* Width 1: Approximately 50.
* Width 3: Approximately 60.
* Width 5: Approximately 55.
* Width Exhausted: Approximately 50.
### Key Observations
* **WebQSP:** Performance improves with increasing depth but degrades with increasing width.
* **CWQ:** Performance improves with increasing depth and width up to a certain point, then plateaus or slightly decreases.
* **Hits@1 vs. F1:** Hits@1 generally shows higher values than F1 for both models.
* **Depth Impact:** Both models show a significant performance boost when increasing depth from 1 to 2.
* **Width Impact:** WebQSP is more sensitive to width changes than CWQ.
### Interpretation
The charts demonstrate the impact of depth and width parameters on the performance of WebQSP and CWQ models. The results suggest that increasing depth generally improves performance for both models, likely due to the ability to explore more relevant information. However, increasing width appears to have a detrimental effect on WebQSP, while CWQ shows a more nuanced response, with performance initially improving and then plateauing.
The difference in behavior between the two models suggests that they have different underlying mechanisms for processing information. WebQSP may be more susceptible to noise or irrelevant information when the width is increased, while CWQ may be better at filtering out such noise.
The plateauing effect observed in some charts indicates that there is a diminishing return to increasing depth or width beyond a certain point. This suggests that there is an optimal range for these parameters, and exceeding that range does not necessarily lead to further performance improvements. The "Exhausted" width value likely represents a point where the model is processing an excessive amount of information, leading to decreased efficiency.