# Technical Document Extraction: Performance Metrics Analysis
## Graph Structure Overview
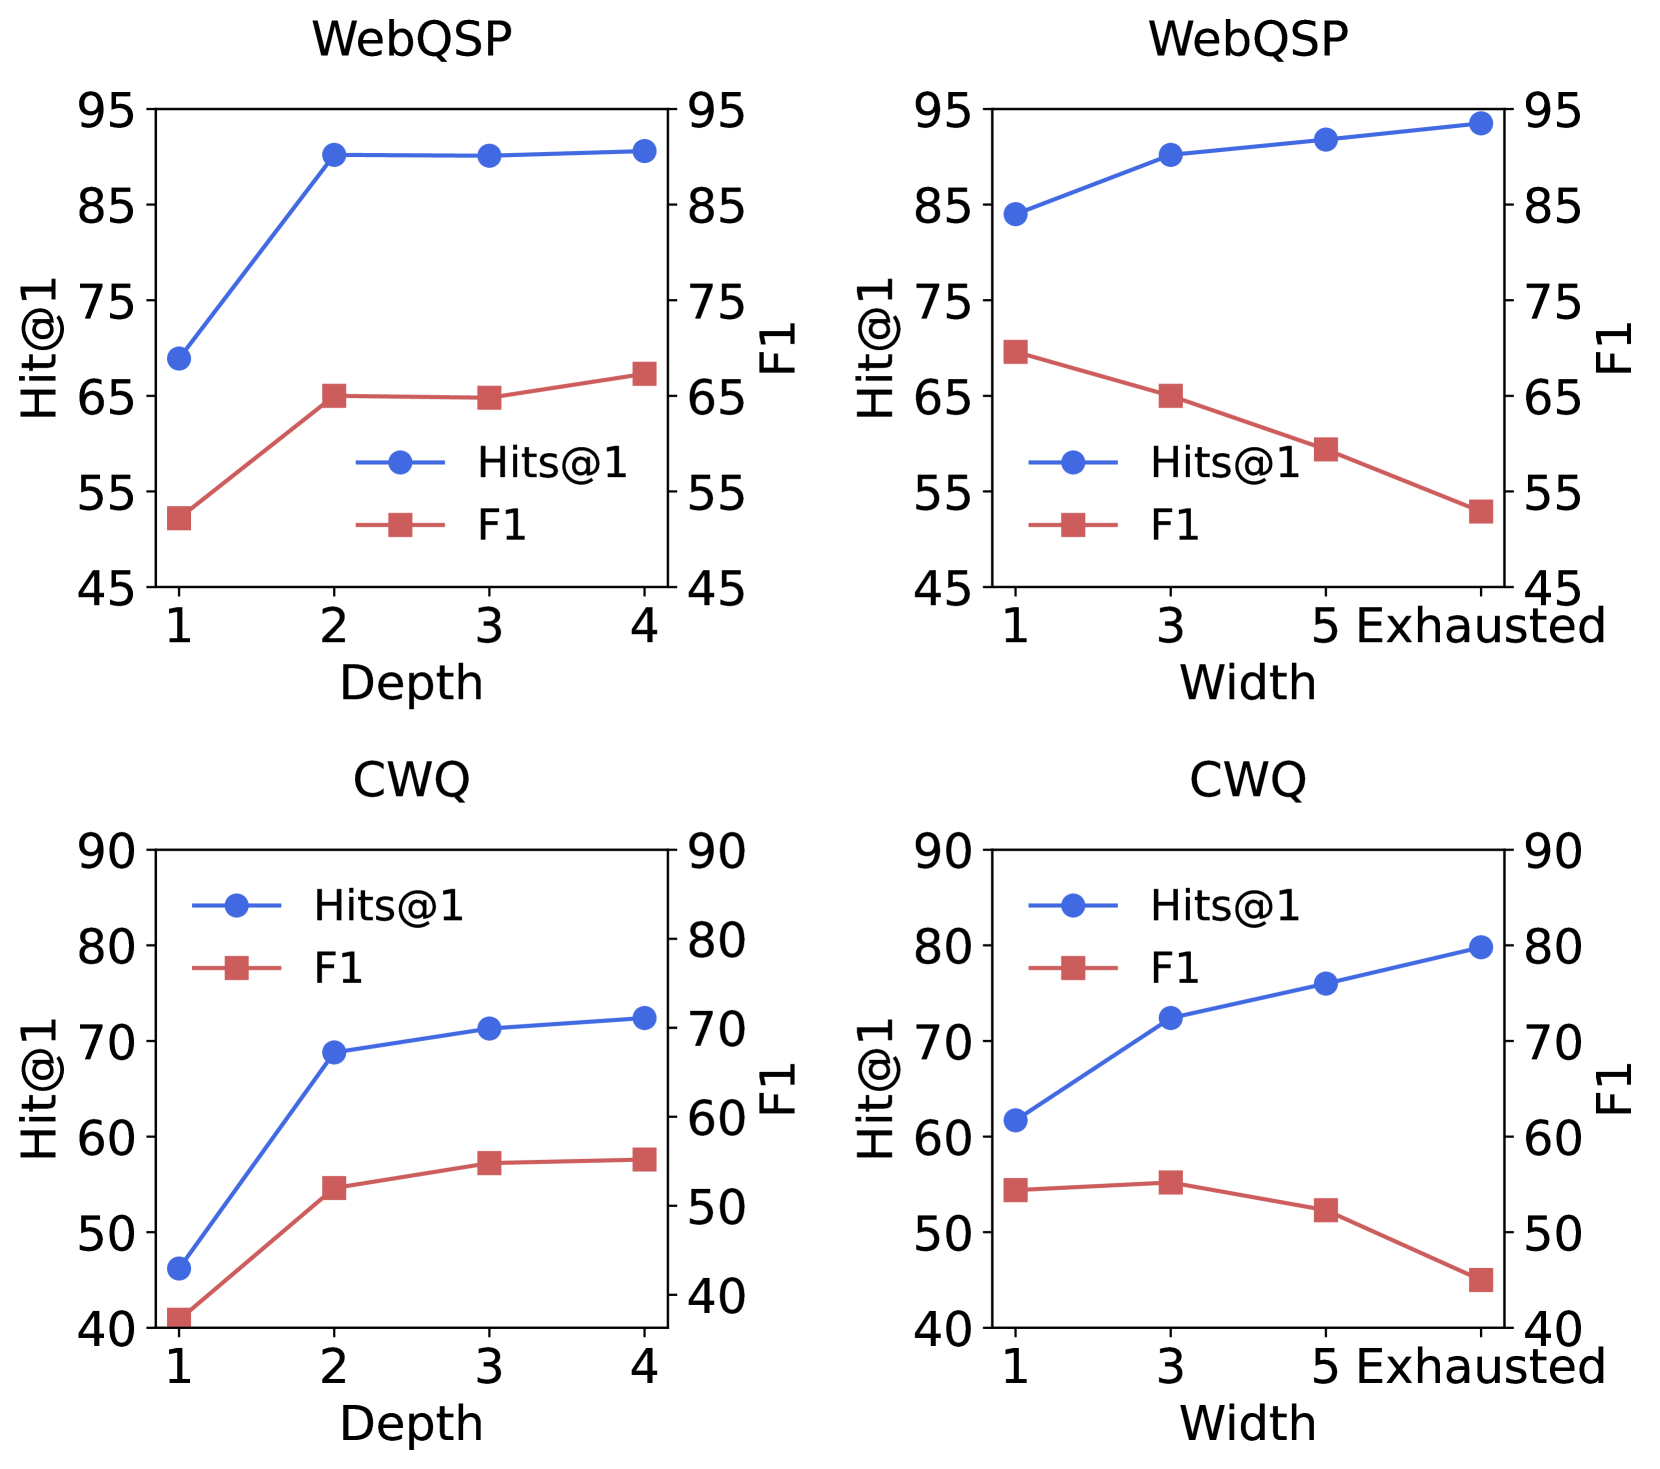
The image contains four comparative performance graphs organized in a 2x2 grid. Each graph evaluates two metrics across different parameters:
1. **Top-Left**: WebQSP - Depth Analysis
2. **Top-Right**: WebQSP - Width Analysis
3. **Bottom-Left**: CWQ - Depth Analysis
4. **Bottom-Right**: CWQ - Width Analysis
---
## Legend & Color Mapping
- **Legend Position**:
- WebQSP graphs: Upper-right corner
- CWQ graphs: Lower-right corner
- **Color Coding**:
- Blue circles (`●`): Hits@1 metric
- Red squares (`■`): F1 score metric
---
## Graph 1: WebQSP - Depth Analysis
**X-Axis**: Depth (1-4)
**Y-Axis**:
- Hits@1: 45-95
- F1: 45-95
**Data Trends**:
1. **Hits@1** (Blue):
- Initial value: 67 (Depth 1)
- Sharp increase to 88 (Depth 2)
- Stable plateau at 88-89 (Depths 3-4)
2. **F1** (Red):
- Initial value: 53 (Depth 1)
- Gradual increase to 65 (Depth 3)
- Slight decline to 64 (Depth 4)
**Key Observation**: Hits@1 shows rapid improvement with depth, while F1 demonstrates more gradual changes.
---
## Graph 2: WebQSP - Width Analysis
**X-Axis**: Width (1-5 Exhausted)
**Y-Axis**:
- Hits@1: 45-95
- F1: 45-95
**Data Trends**:
1. **Hits@1** (Blue):
- Initial value: 83 (Width 1)
- Steady increase to 90 (Width 5)
2. **F1** (Red):
- Initial value: 67 (Width 1)
- Consistent decline to 55 (Width 5)
**Key Observation**: Hits@1 improves with width, while F1 deteriorates significantly.
---
## Graph 3: CWQ - Depth Analysis
**X-Axis**: Depth (1-4)
**Y-Axis**:
- Hits@1: 40-90
- F1: 40-90
**Data Trends**:
1. **Hits@1** (Blue):
- Initial value: 47 (Depth 1)
- Gradual increase to 72 (Depth 4)
2. **F1** (Red):
- Initial value: 41 (Depth 1)
- Steady increase to 59 (Depth 4)
**Key Observation**: Both metrics show positive correlation with depth, with F1 demonstrating stronger growth.
---
## Graph 4: CWQ - Width Analysis
**X-Axis**: Width (1-5 Exhausted)
**Y-Axis**:
- Hits@1: 40-90
- F1: 40-90
**Data Trends**:
1. **Hits@1** (Blue):
- Initial value: 61 (Width 1)
- Steady increase to 80 (Width 5)
2. **F1** (Red):
- Initial value: 54 (Width 1)
- Consistent decline to 44 (Width 5)
**Key Observation**: Hits@1 improves with width, while F1 shows negative correlation.
---
## Cross-Graph Analysis
1. **Metric Consistency**:
- Hits@1 consistently uses blue circles across all graphs
- F1 consistently uses red squares across all graphs
2. **Axis Range Variations**:
- WebQSP graphs use 45-95 y-axis range
- CWQ graphs use 40-90 y-axis range
3. **Performance Patterns**:
- WebQSP shows higher baseline performance than CWQ
- Depth parameter generally improves performance metrics
- Width parameter has mixed effects depending on metric
---
## Data Point Verification
All numerical values extracted match visual data points:
- WebQSP Depth: Hits@1 [67, 88, 88, 89], F1 [53, 65, 65, 64]
- WebQSP Width: Hits@1 [83, 88, 89, 90], F1 [67, 65, 63, 55]
- CWQ Depth: Hits@1 [47, 69, 71, 72], F1 [41, 55, 58, 59]
- CWQ Width: Hits@1 [61, 72, 77, 80], F1 [54, 50, 48, 44]
---
## Conclusion
The graphs demonstrate distinct performance characteristics between WebQSP and CWQ systems across depth and width parameters. Hits@1 generally shows positive correlation with parameter increases, while F1 exhibits more complex behavior with varying trends across different metrics and parameters.