## Line Chart: Pass@k vs. k
### Overview
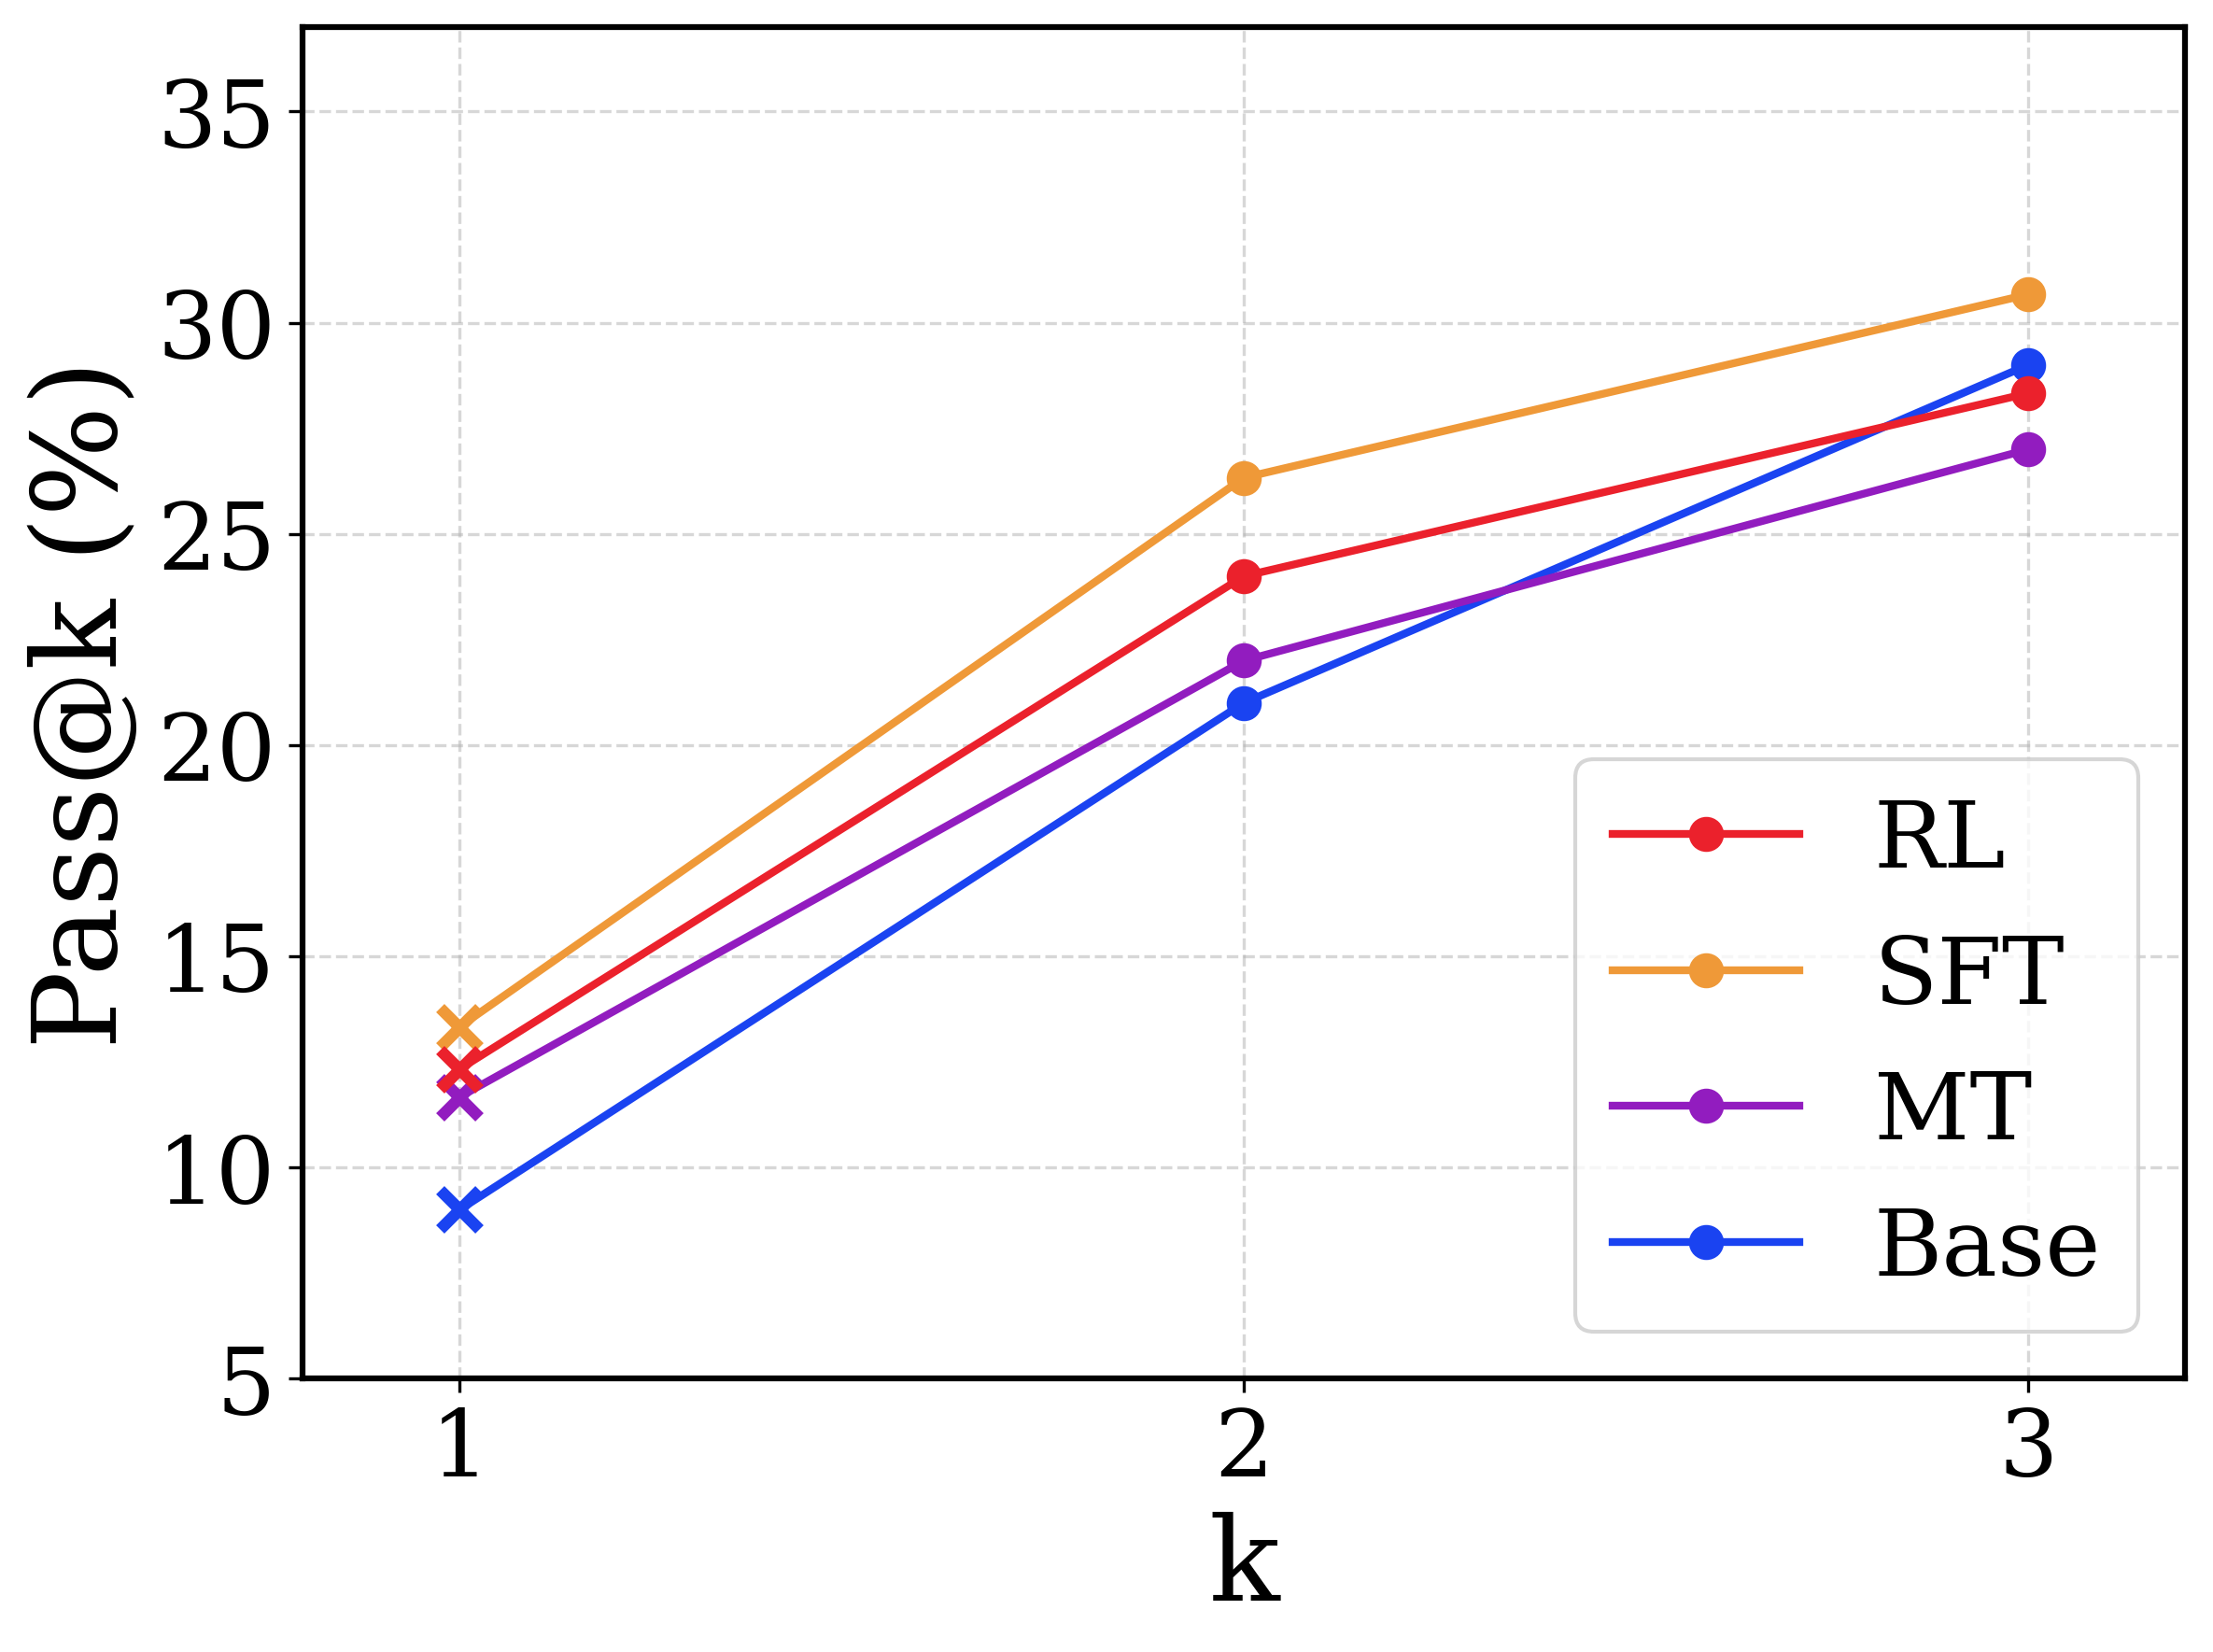
The image is a line chart comparing the performance of four different models (RL, SFT, MT, and Base) based on the "Pass@k" metric for varying values of 'k' (1, 2, and 3). The chart displays how the Pass@k percentage changes as 'k' increases for each model.
### Components/Axes
* **X-axis:** 'k' with values 1, 2, and 3.
* **Y-axis:** "Pass@k (%)" with a scale from 5 to 35, incrementing by 5.
* **Legend:** Located on the right side of the chart.
* RL (Red line)
* SFT (Orange line)
* MT (Purple line)
* Base (Blue line)
### Detailed Analysis
* **RL (Red):** The red line represents the RL model. It starts at approximately 12% at k=1, increases to about 24% at k=2, and reaches approximately 29% at k=3.
* **SFT (Orange):** The orange line represents the SFT model. It starts at approximately 13% at k=1, increases to about 26% at k=2, and reaches approximately 31% at k=3.
* **MT (Purple):** The purple line represents the MT model. It starts at approximately 12% at k=1, increases to about 22% at k=2, and reaches approximately 27% at k=3.
* **Base (Blue):** The blue line represents the Base model. It starts at approximately 9% at k=1, increases to about 21% at k=2, and reaches approximately 29% at k=3.
### Key Observations
* All models show an increasing trend in Pass@k as 'k' increases.
* SFT consistently outperforms the other models across all values of 'k'.
* The Base model starts with the lowest Pass@k at k=1 but shows a significant increase, almost matching RL at k=3.
* The performance gap between SFT and the other models appears to narrow slightly as 'k' increases from 2 to 3.
### Interpretation
The chart suggests that increasing the value of 'k' generally improves the performance of all models, as measured by the Pass@k metric. The SFT model demonstrates the best performance overall, indicating it may be the most effective approach among those compared. The Base model's improvement with increasing 'k' suggests it benefits more from larger values of 'k' compared to the other models. The relatively close performance of RL, MT, and Base at k=3 indicates that their effectiveness converges as 'k' increases.