## Line Chart: Pass@k Performance Comparison of Four Methods
### Overview
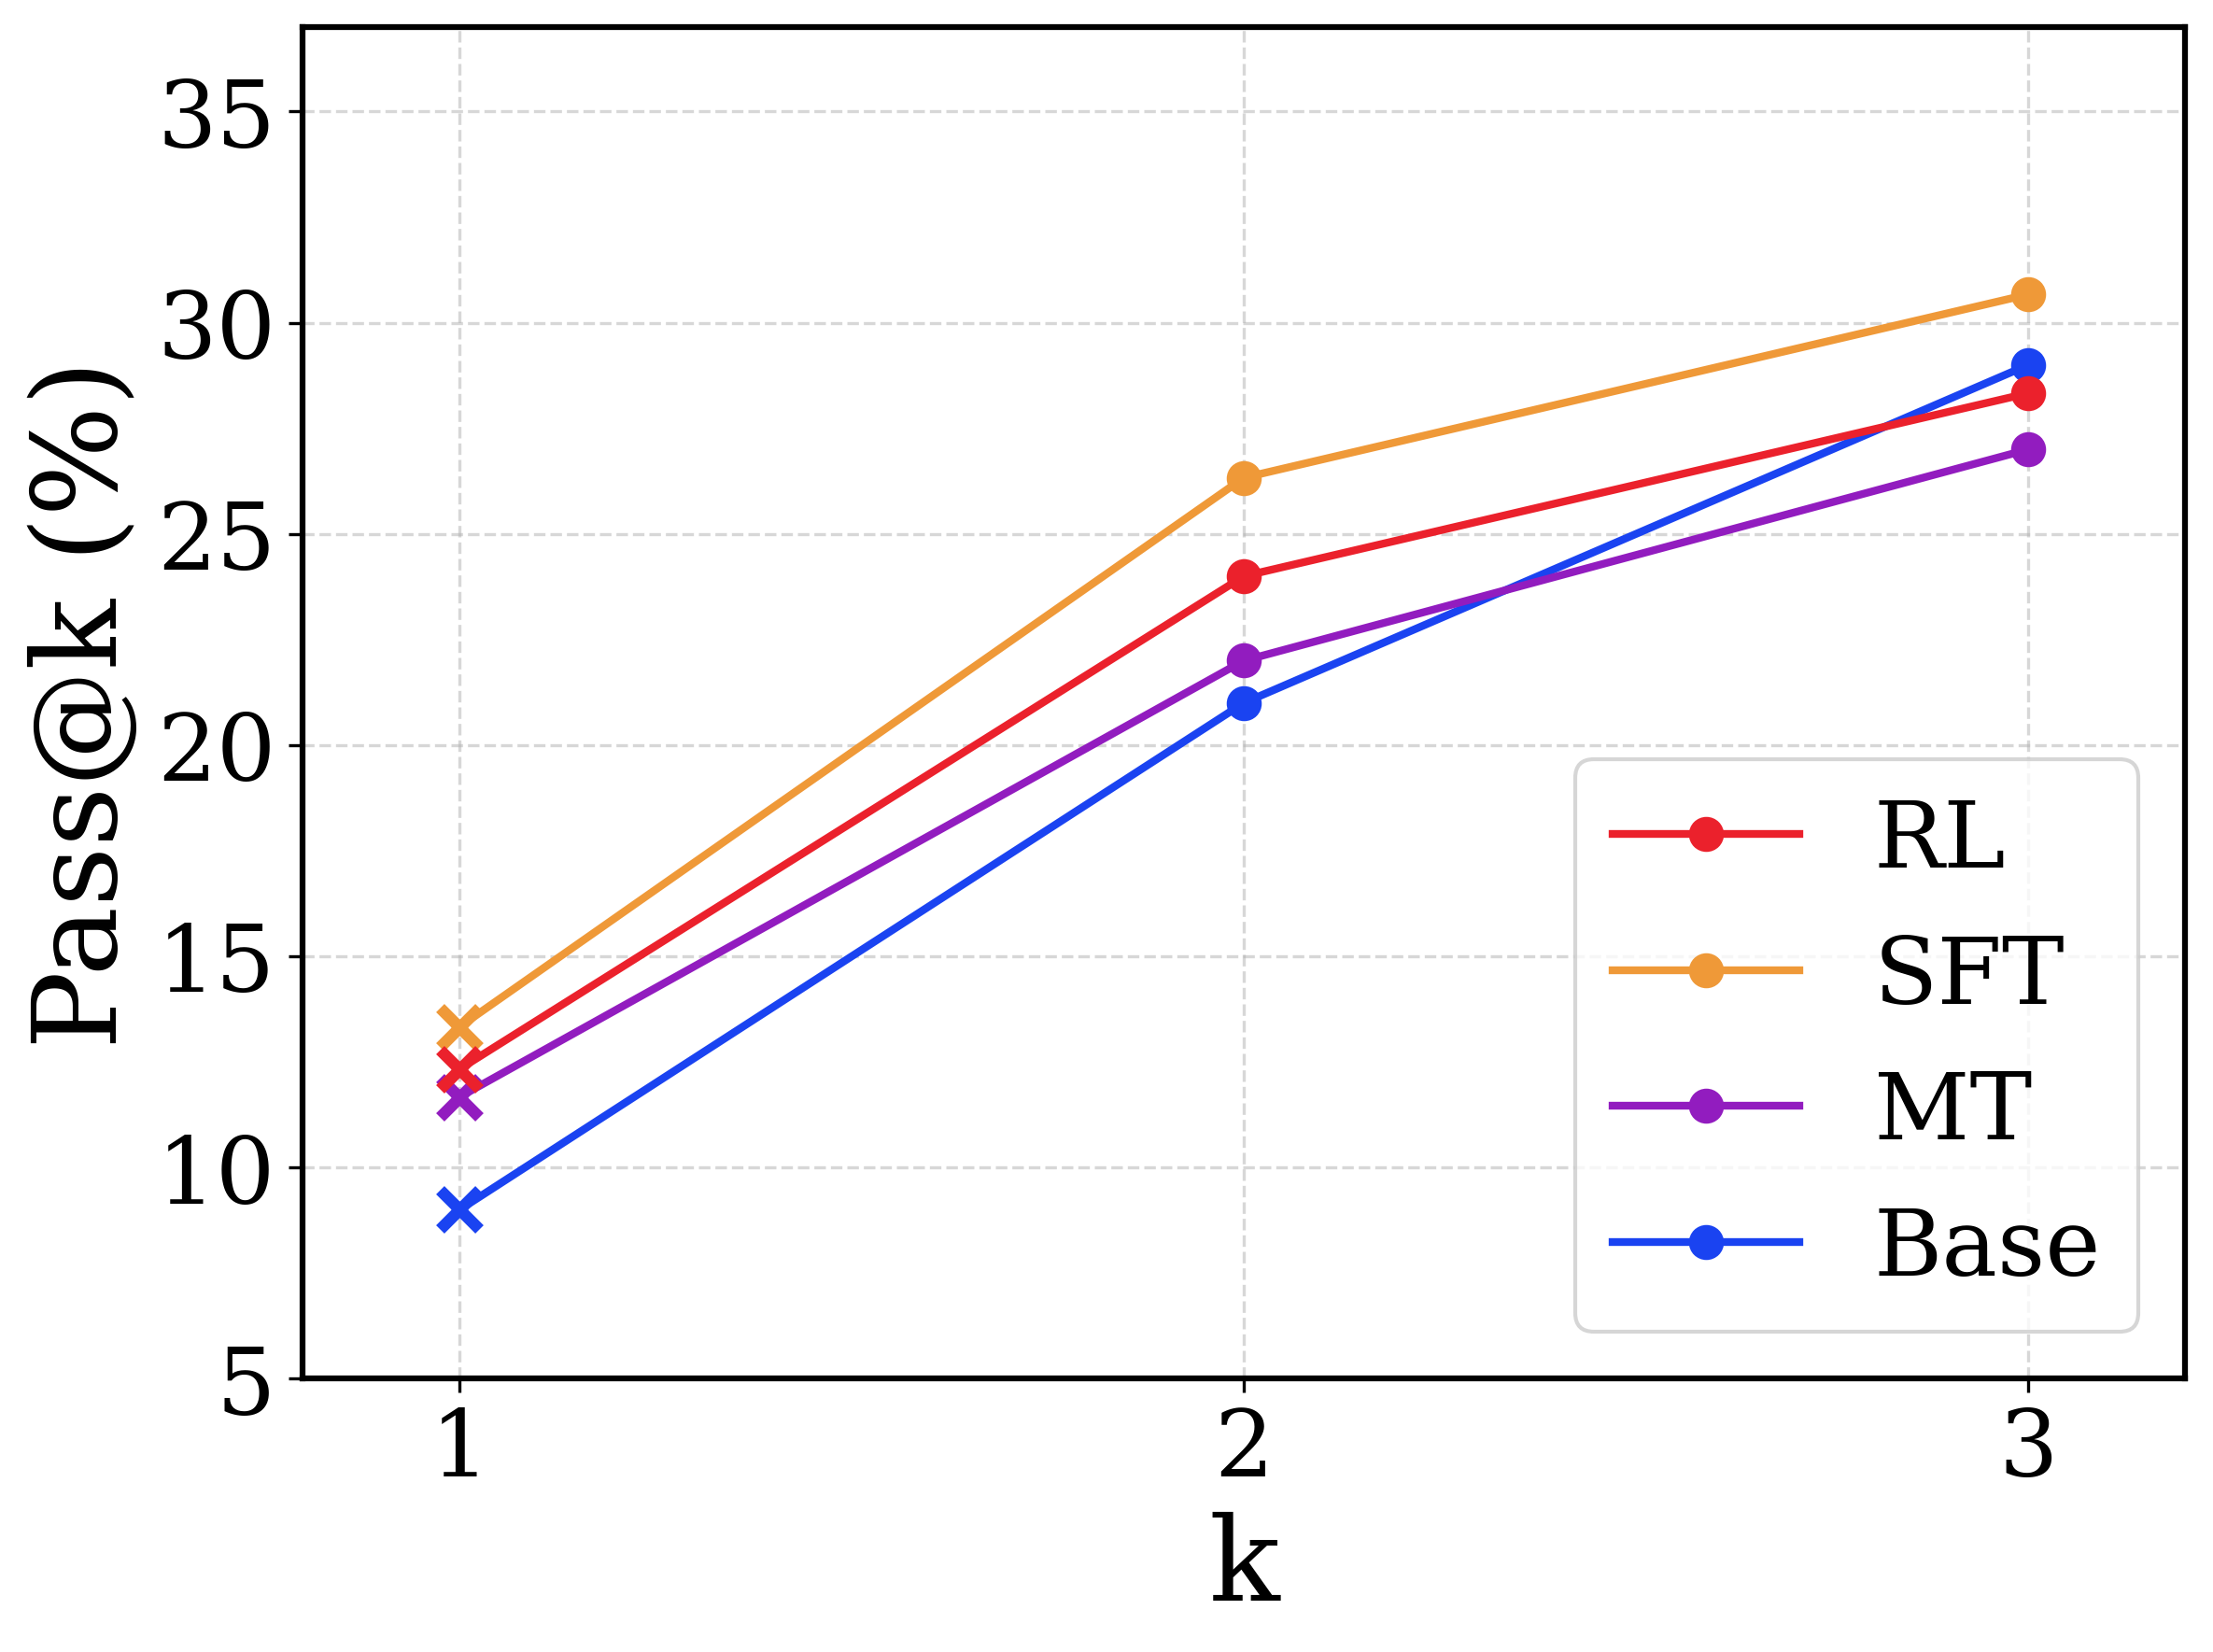
This image is a line chart comparing the performance of four different methods—RL, SFT, MT, and Base—using the Pass@k metric (expressed as a percentage). The chart plots performance across three values of k (1, 2, and 3). All methods show a positive trend, with Pass@k increasing as k increases.
### Components/Axes
- **X-axis**: Labeled "k". Discrete markers at values 1, 2, and 3.
- **Y-axis**: Labeled "Pass@k (%)". Linear scale from 5 to 35, with major gridlines at intervals of 5 (5, 10, 15, 20, 25, 30, 35).
- **Legend**: Located in the bottom-right corner of the plot area. It contains four entries, each with a colored line and circular marker:
- **RL**: Red line with red circular markers.
- **SFT**: Orange line with orange circular markers.
- **MT**: Purple line with purple circular markers.
- **Base**: Blue line with blue circular markers.
- **Plot Area**: Contains a light gray dashed grid for both axes. The four data series are plotted as solid lines connecting circular data points.
### Detailed Analysis
**Trend Verification**: All four lines slope upward from left to right, indicating that Pass@k performance improves for all methods as k increases from 1 to 3.
**Data Points (Approximate Values)**:
| k | SFT (Orange) | RL (Red) | MT (Purple) | Base (Blue) |
|-----|--------------|----------|-------------|-------------|
| 1 | ~13.5% | ~12.5% | ~11.5% | ~9.0% |
| 2 | ~26.5% | ~24.0% | ~22.0% | ~21.0% |
| 3 | ~30.5% | ~28.5% | ~27.0% | ~29.0% |
**Component Isolation & Cross-Reference**:
- The legend order (RL, SFT, MT, Base) does not correspond to the final performance order at k=3.
- At k=1 and k=2, the performance order from highest to lowest is consistently: SFT > RL > MT > Base.
- At k=3, the order changes. The Base method (blue) shows the steepest improvement between k=2 and k=3, surpassing both RL (red) and MT (purple) to claim the second-highest position. The final order at k=3 is: SFT > Base > RL > MT.
### Key Observations
1. **Consistent Leader**: The SFT method (orange line) is the top performer at every measured value of k.
2. **Convergence at Higher k**: The performance gap between the methods narrows as k increases. The spread at k=1 is approximately 4.5 percentage points (from ~9% to ~13.5%), while at k=3 it is approximately 3.5 percentage points (from ~27% to ~30.5%).
3. **Strong Late Improvement by Base**: The Base method (blue line) exhibits the most significant relative gain, improving by approximately 20 percentage points from k=1 to k=3. Its slope between k=2 and k=3 is notably steeper than the other methods.
4. **RL and MT Plateauing**: The RL (red) and MT (purple) methods show a slightly less pronounced increase in performance between k=2 and k=3 compared to their initial jump from k=1 to k=2.
### Interpretation
This chart likely evaluates different training or prompting strategies for a generative model (e.g., for code synthesis or problem-solving), where **Pass@k** measures the probability that at least one of *k* independently generated samples is correct.
- **What the data suggests**: Supervised Fine-Tuning (SFT) provides the most robust performance boost across all levels of sampling (k). The base model, while starting with the lowest single-attempt success rate (Pass@1), benefits disproportionately from being allowed more attempts (higher k), nearly catching up to the reinforcement learning (RL) method at k=3.
- **Relationship between elements**: The upward trend for all lines confirms the fundamental principle that generating more samples increases the chance of success. The differing slopes suggest that the methods affect not just the base performance (Pass@1) but also the rate of improvement with additional samples.
- **Notable anomaly/insight**: The crossover where the Base method surpasses RL and MT at k=3 is the most significant finding. It implies that while fine-tuning (SFT, RL, MT) improves the model's "first-shot" capability, the underlying base model may have a higher capacity for generating diverse solutions that, given enough attempts, can match or exceed the solutions produced by some fine-tuned variants. This could indicate that certain fine-tuning methods might reduce output diversity in favor of higher initial accuracy.