# Technical Document Extraction: Line Chart Analysis
## 1. Axis Labels and Markers
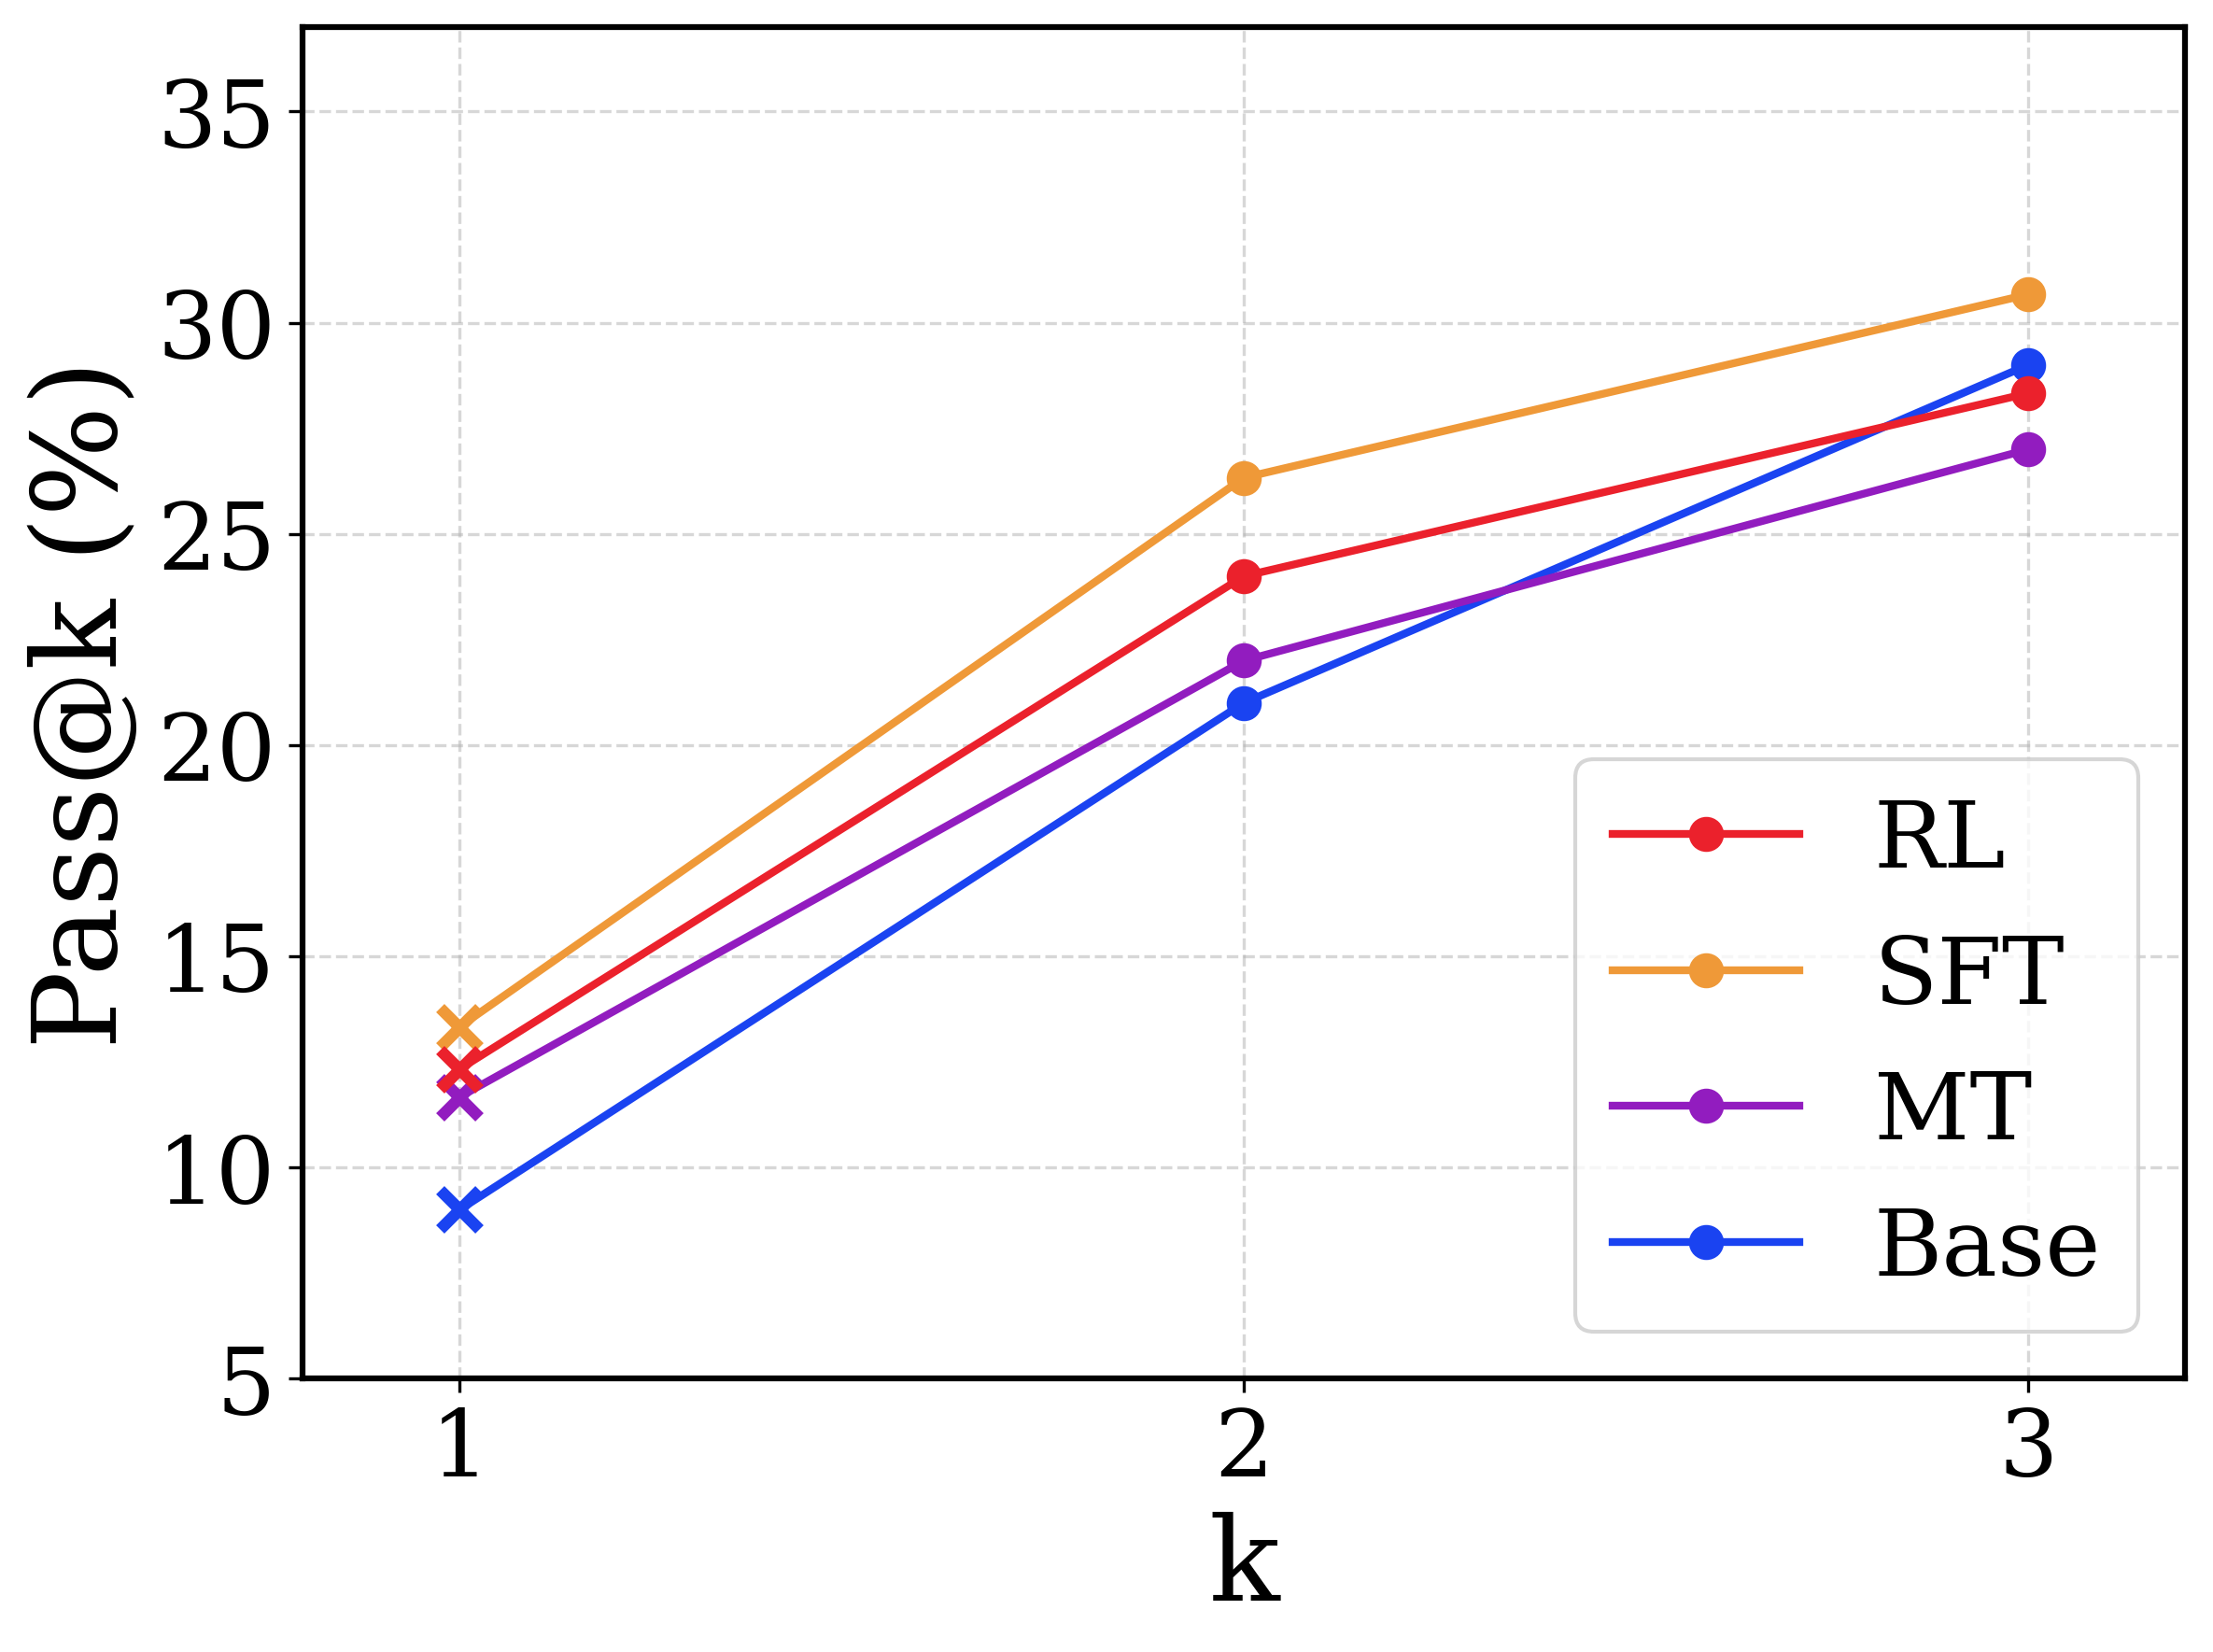
- **X-axis**: Labeled "k" with discrete markers at positions 1, 2, 3.
- **Y-axis**: Labeled "Pass@k (%)" with tick marks at 5, 10, 15, 20, 25, 30, 35.
## 2. Legend and Color Mapping
- **Legend Position**: Bottom-right quadrant of the chart.
- **Color-Coded Series**:
- **RL**: Red line with circular markers.
- **SFT**: Orange line with circular markers.
- **MT**: Purple line with circular markers.
- **Base**: Blue line with circular markers.
## 3. Data Series and Trends
### RL (Red)
- **Trend**: Steady upward slope.
- **Data Points**:
- k=1: 12%
- k=2: 24%
- k=3: 28%
### SFT (Orange)
- **Trend**: Steepest upward trajectory.
- **Data Points**:
- k=1: 13%
- k=2: 26%
- k=3: 30%
### MT (Purple)
- **Trend**: Moderate upward slope.
- **Data Points**:
- k=1: 11%
- k=2: 22%
- k=3: 27%
### Base (Blue)
- **Trend**: Gradual upward slope with acceleration at k=3.
- **Data Points**:
- k=1: 9%
- k=2: 21%
- k=3: 29%
## 4. Spatial Grounding
- **Legend Coordinates**: [x=0.85, y=0.15] (normalized to chart dimensions).
- **Data Point Verification**:
- All series colors match legend entries (e.g., red = RL, orange = SFT).
## 5. Key Observations
- **SFT** consistently outperforms other methods across all k values.
- **Base** shows the slowest growth but surpasses MT at k=3.
- **RL** and **MT** exhibit similar growth patterns but diverge at k=3.
## 6. Data Table Reconstruction
| k | RL (%) | SFT (%) | MT (%) | Base (%) |
|---|--------|---------|--------|----------|
| 1 | 12 | 13 | 11 | 9 |
| 2 | 24 | 26 | 22 | 21 |
| 3 | 28 | 30 | 27 | 29 |
## 7. Language Declaration
- **Primary Language**: English (all labels, axis titles, and annotations are in English).