## Line Chart: Dialectic with Annealing τ
### Overview
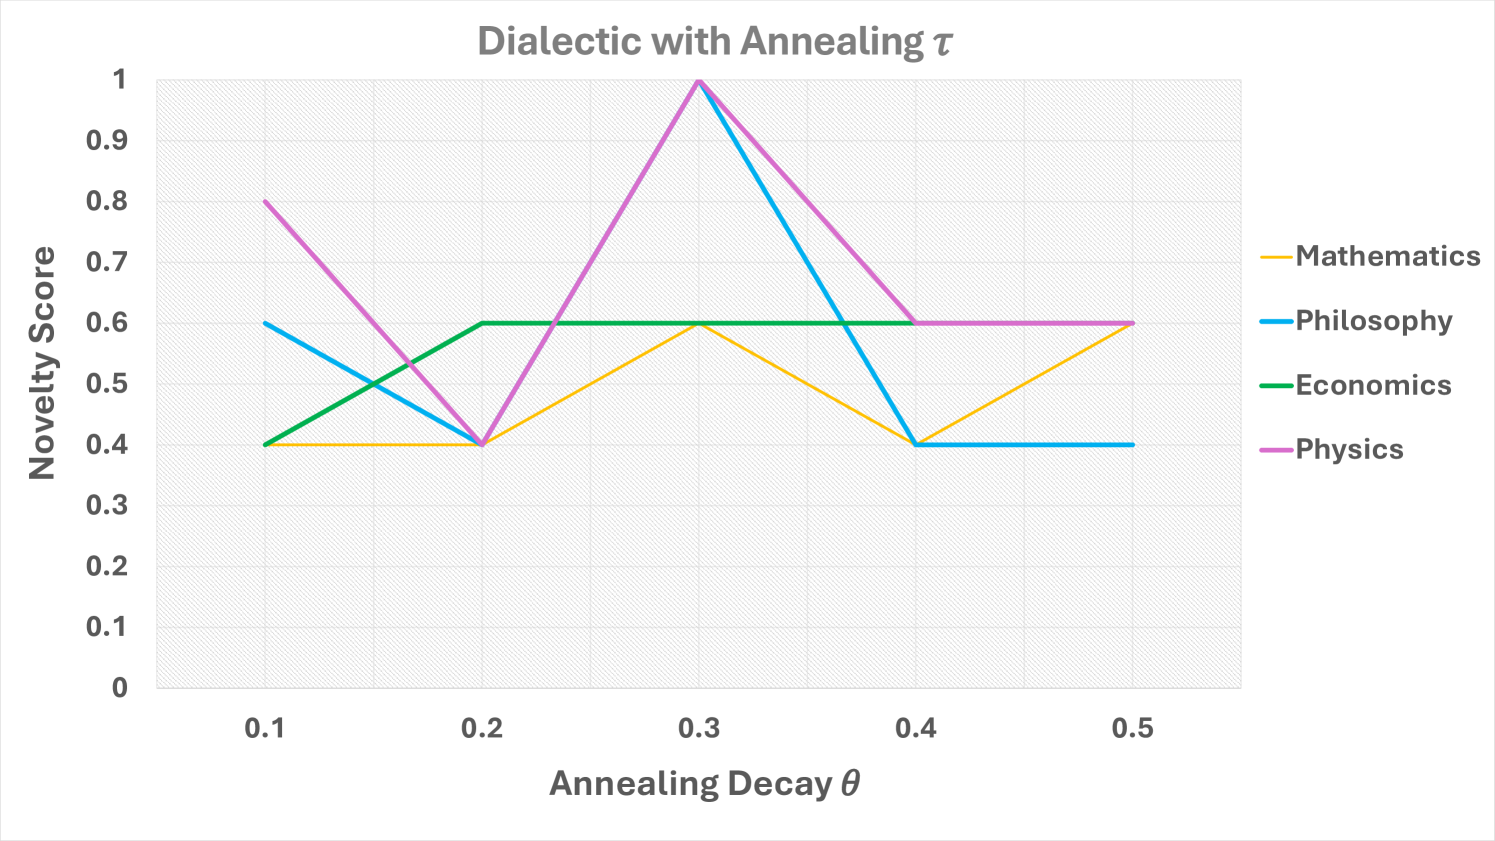
The image is a line chart titled "Dialectic with Annealing τ". It shows the relationship between "Novelty Score" and "Annealing Decay θ" for four different categories: Mathematics, Philosophy, Economics, and Physics. The chart displays how the novelty score changes with annealing decay for each category.
### Components/Axes
* **Title:** Dialectic with Annealing τ
* **X-axis:** Annealing Decay θ, with values ranging from 0.1 to 0.5 in increments of 0.1.
* **Y-axis:** Novelty Score, with values ranging from 0 to 1 in increments of 0.1.
* **Legend:** Located on the right side of the chart, associating colors with categories:
* Yellow: Mathematics
* Blue: Philosophy
* Green: Economics
* Magenta: Physics
### Detailed Analysis
* **Mathematics (Yellow):**
* Starts at a Novelty Score of approximately 0.4 at an Annealing Decay of 0.1.
* Remains constant at 0.4 until an Annealing Decay of 0.2.
* Increases to 0.6 at an Annealing Decay of 0.3.
* Decreases to 0.4 at an Annealing Decay of 0.4.
* Increases to 0.6 at an Annealing Decay of 0.5.
* **Philosophy (Blue):**
* Starts at a Novelty Score of approximately 0.6 at an Annealing Decay of 0.1.
* Decreases to 0.4 at an Annealing Decay of 0.2.
* Increases to 1.0 at an Annealing Decay of 0.3.
* Decreases to 0.4 at an Annealing Decay of 0.4.
* Remains constant at 0.4 at an Annealing Decay of 0.5.
* **Economics (Green):**
* Starts at a Novelty Score of approximately 0.4 at an Annealing Decay of 0.1.
* Increases to 0.6 at an Annealing Decay of 0.2.
* Remains constant at 0.6 until an Annealing Decay of 0.5.
* **Physics (Magenta):**
* Starts at a Novelty Score of approximately 0.8 at an Annealing Decay of 0.1.
* Decreases to 0.4 at an Annealing Decay of 0.2.
* Increases to 1.0 at an Annealing Decay of 0.3.
* Decreases to 0.6 at an Annealing Decay of 0.4.
* Remains constant at 0.6 at an Annealing Decay of 0.5.
### Key Observations
* Physics and Philosophy have the same Novelty Score of 1.0 at an Annealing Decay of 0.3.
* Economics maintains a constant Novelty Score of 0.6 from an Annealing Decay of 0.2 to 0.5.
* Mathematics has the lowest Novelty Score at an Annealing Decay of 0.1 and 0.2, with a value of 0.4.
* All categories except Economics have a Novelty Score of 0.4 at an Annealing Decay of 0.2.
* Philosophy and Physics have the most volatile Novelty Scores, with large increases and decreases.
### Interpretation
The chart illustrates how the novelty score of different academic disciplines changes with varying levels of annealing decay. The data suggests that Philosophy and Physics are more sensitive to changes in annealing decay, as their novelty scores fluctuate significantly. Economics, on the other hand, appears to be more stable, maintaining a constant novelty score over a range of annealing decay values. Mathematics shows a more gradual change in novelty score compared to Philosophy and Physics. The peak in Philosophy and Physics at an annealing decay of 0.3 could indicate an optimal level of decay for these fields, while the consistent performance of Economics might suggest a different underlying dynamic.