\n
## Line Chart: Dialectic with Annealing τ
### Overview
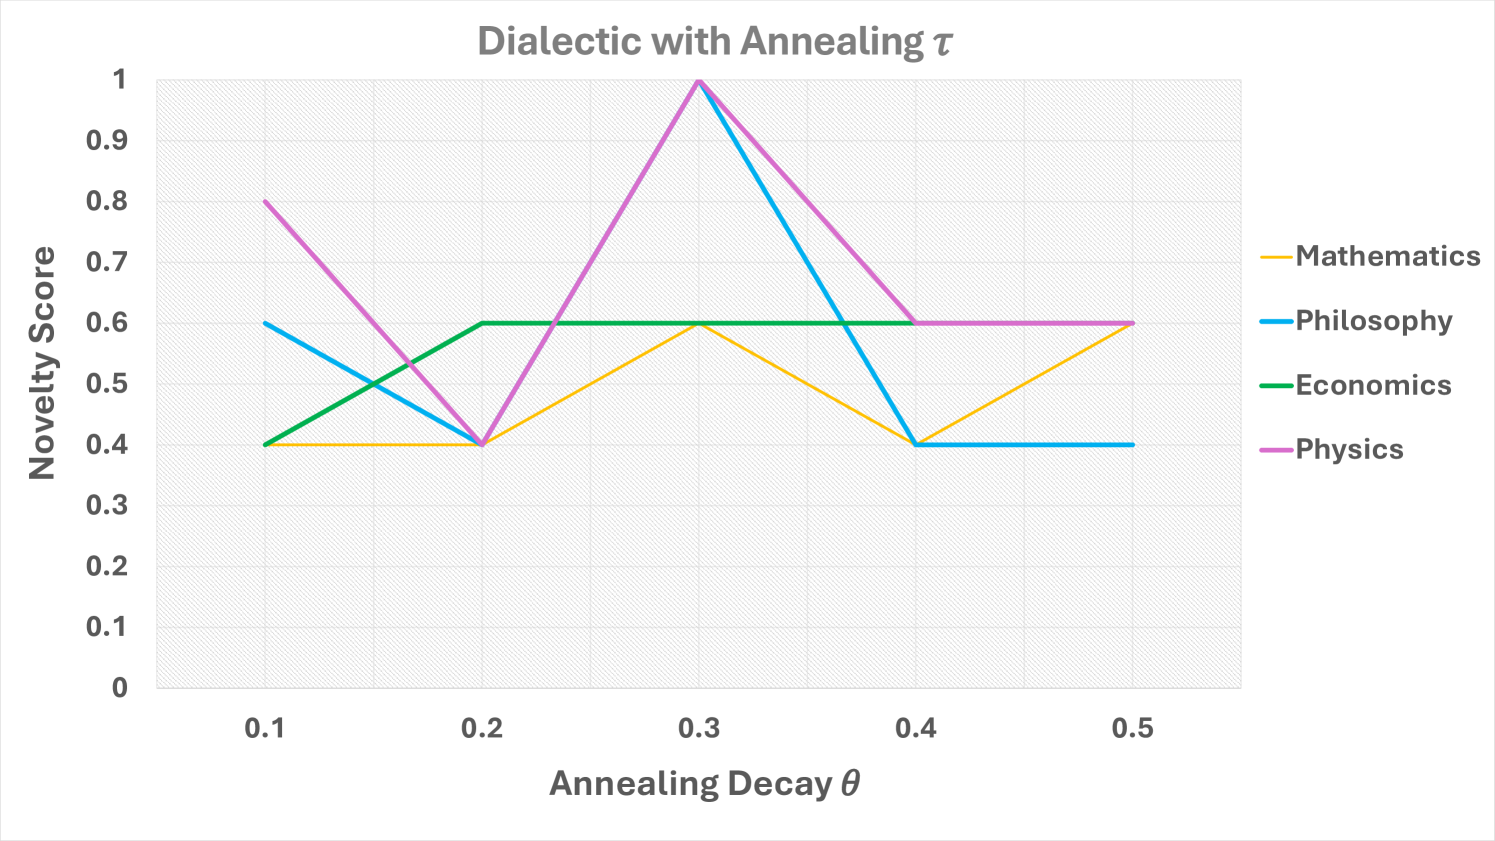
The image presents a line chart illustrating the relationship between "Annealing Decay θ" and "Novelty Score" for four different disciplines: Mathematics, Philosophy, Economics, and Physics. The chart appears to model a process of dialectic with annealing, where the annealing decay parameter influences the novelty score achieved in each field.
### Components/Axes
* **Title:** Dialectic with Annealing τ
* **X-axis:** Annealing Decay θ (ranging from 0 to 0.5, with markers at 0.1, 0.2, 0.3, 0.4, and 0.5)
* **Y-axis:** Novelty Score (ranging from 0 to 1, with markers at 0.1 intervals)
* **Legend:** Located in the top-right corner, listing the disciplines and their corresponding line colors:
* Mathematics (Yellow)
* Philosophy (Blue)
* Economics (Green)
* Physics (Purple)
### Detailed Analysis
Here's a breakdown of each discipline's trend and approximate data points, verified against the legend colors:
* **Mathematics (Yellow):** The line starts at approximately 0.4, increases slightly to around 0.55 at θ = 0.2, remains relatively stable around 0.55-0.6 until θ = 0.4, and then decreases to approximately 0.4 at θ = 0.5.
* **Philosophy (Blue):** This line exhibits a strong upward trend from θ = 0.1 (approximately 0.55) to a peak at θ = 0.3 (approximately 0.95), followed by a sharp decline to around 0.4 at θ = 0.5.
* **Economics (Green):** The line begins at approximately 0.4, increases to around 0.6 at θ = 0.2, decreases to approximately 0.45 at θ = 0.3, and then remains relatively stable around 0.4-0.5 until θ = 0.5.
* **Physics (Purple):** The line starts at approximately 0.6, decreases to around 0.4 at θ = 0.2, increases to approximately 0.7 at θ = 0.3, and then declines to around 0.4 at θ = 0.5.
### Key Observations
* Philosophy demonstrates the most dramatic fluctuation in Novelty Score, peaking at θ = 0.3.
* Mathematics exhibits the most stable Novelty Score throughout the range of Annealing Decay.
* Economics and Physics show similar trends, with initial decreases followed by increases and then declines.
* All disciplines converge towards a Novelty Score of approximately 0.4 at θ = 0.5.
### Interpretation
The chart suggests that the optimal "Annealing Decay" parameter for maximizing novelty differs significantly between disciplines. Philosophy appears to benefit most from an annealing decay of around 0.3, while Mathematics is less sensitive to changes in this parameter. The convergence of all lines at higher annealing decay values (θ = 0.5) could indicate a point of diminishing returns, where further annealing leads to a loss of novelty across all fields.
The concept of "dialectic with annealing" implies a process of iterative refinement and exploration. The annealing decay parameter likely controls the rate at which the system settles into a stable state. A lower decay rate (smaller θ) allows for more exploration and potentially higher novelty, but also risks instability. A higher decay rate (larger θ) promotes stability but may limit the potential for novel discoveries.
The differences in optimal annealing decay values across disciplines could reflect the inherent characteristics of each field. For example, Philosophy, which often deals with abstract concepts and open-ended questions, may benefit from a more exploratory approach (lower annealing decay), while Mathematics, which relies on rigorous proof and established axioms, may require a more conservative approach (higher annealing decay).