## Line Chart: Dialectic with Annealing τ
### Overview
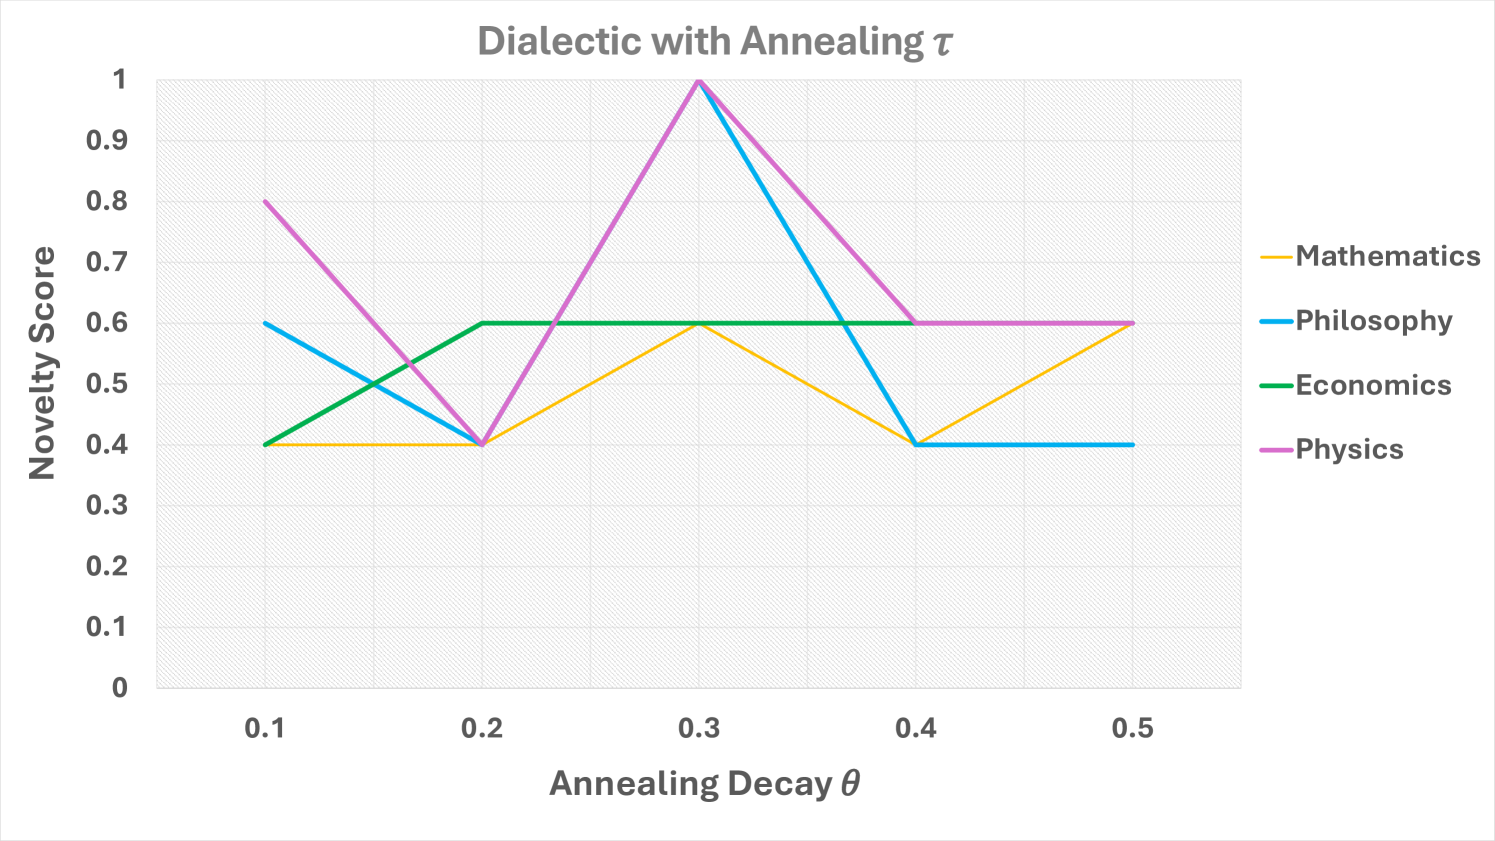
The chart visualizes the relationship between "Annealing Decay θ" (x-axis) and "Novelty Score" (y-axis) across four disciplines: Mathematics, Philosophy, Economics, and Physics. Each discipline is represented by a distinct colored line, with data points plotted at θ values of 0.1, 0.2, 0.3, 0.4, and 0.5. The y-axis ranges from 0 to 1, while the x-axis spans 0.1 to 0.5.
### Components/Axes
- **Title**: "Dialectic with Annealing τ" (centered at the top).
- **X-axis**: Labeled "Annealing Decay θ" with tick marks at 0.1, 0.2, 0.3, 0.4, and 0.5.
- **Y-axis**: Labeled "Novelty Score" with tick marks at 0, 0.1, 0.2, ..., 1.0.
- **Legend**: Located on the right side, associating colors with disciplines:
- **Mathematics**: Orange
- **Philosophy**: Blue
- **Economics**: Green
- **Physics**: Purple
### Detailed Analysis
1. **Mathematics (Orange Line)**:
- Starts at (0.1, 0.4).
- Rises to (0.3, 0.6), then dips to (0.4, 0.4), and peaks again at (0.5, 0.6).
- **Trend**: U-shaped with a local maximum at θ=0.3 and θ=0.5.
2. **Philosophy (Blue Line)**:
- Begins at (0.1, 0.6).
- Drops to (0.2, 0.4), surges to (0.3, 1.0), then declines to (0.4, 0.4) and (0.5, 0.4).
- **Trend**: Sharp peak at θ=0.3, followed by a decline.
3. **Economics (Green Line)**:
- Starts at (0.1, 0.4).
- Rises to (0.2, 0.6) and remains flat at 0.6 for θ=0.3, 0.4, and 0.5.
- **Trend**: Steady increase to θ=0.2, then constant.
4. **Physics (Purple Line)**:
- Begins at (0.1, 0.8).
- Drops to (0.2, 0.4), surges to (0.3, 1.0), then declines to (0.4, 0.6) and (0.5, 0.6).
- **Trend**: Sharp peak at θ=0.3, followed by a moderate decline.
### Key Observations
- **Peaks at θ=0.3**: Philosophy and Physics both reach the maximum novelty score of 1.0 at θ=0.3.
- **Stability in Economics**: Economics maintains a constant novelty score of 0.6 after θ=0.2.
- **Mathematics' Bimodal Behavior**: Shows two peaks (θ=0.3 and θ=0.5) with a dip in between.
- **Philosophy's Sharp Decline**: After the peak at θ=0.3, its score drops to 0.4 and remains flat.
### Interpretation
The chart suggests that **Physics and Philosophy** exhibit the highest sensitivity to annealing decay, with their novelty scores peaking at θ=0.3. This could imply optimal performance or critical thresholds at this decay value. **Economics** demonstrates stability, indicating resilience to changes in annealing decay after θ=0.2. **Mathematics** shows a bimodal pattern, suggesting two distinct regimes of novelty. The sharp decline in Philosophy and Physics after θ=0.3 might indicate diminishing returns or instability beyond this point. The data highlights the interplay between annealing decay and disciplinary novelty, with potential implications for optimizing parameters in interdisciplinary research.