## Bar Chart: Post-Discussion Sycophancy Rates Across Models and Methods
### Overview
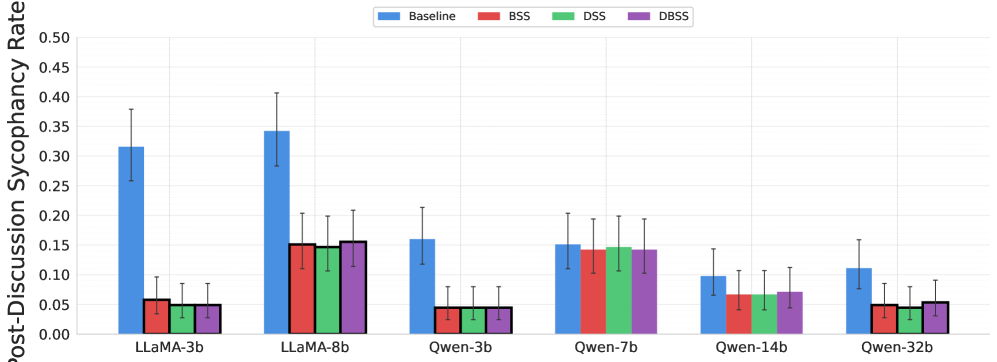
The chart compares post-discussion sycophancy rates (measured on a 0-0.5 scale) for six AI models (LLaMA-3b, LLaMA-8b, Qwen-3b, Qwen-7b, Qwen-14b, Qwen-32b) across four methods: Baseline, BSS, DSS, and DBSS. Error bars indicate variability (±0.05-0.10 range).
### Components/Axes
- **X-axis**: Model names (LLaMA-3b, LLaMA-8b, Qwen-3b, Qwen-7b, Qwen-14b, Qwen-32b)
- **Y-axis**: Sycophancy rate (0.00–0.50)
- **Legend**:
- Blue = Baseline
- Red = BSS
- Green = DSS
- Purple = DBSS
- **Legend Position**: Top-right corner
- **Bar Colors**: Match legend labels (e.g., Baseline bars are blue)
### Detailed Analysis
1. **LLaMA-3b**:
- Baseline: ~0.32 (±0.08)
- BSS: ~0.06 (±0.03)
- DSS: ~0.05 (±0.03)
- DBSS: ~0.05 (±0.03)
2. **LLaMA-8b**:
- Baseline: ~0.34 (±0.09)
- BSS: ~0.15 (±0.05)
- DSS: ~0.14 (±0.05)
- DBSS: ~0.16 (±0.06)
3. **Qwen-3b**:
- Baseline: ~0.16 (±0.07)
- BSS: ~0.05 (±0.03)
- DSS: ~0.05 (±0.03)
- DBSS: ~0.05 (±0.03)
4. **Qwen-7b**:
- Baseline: ~0.15 (±0.08)
- BSS: ~0.14 (±0.06)
- DSS: ~0.14 (±0.06)
- DBSS: ~0.14 (±0.06)
5. **Qwen-14b**:
- Baseline: ~0.10 (±0.06)
- BSS: ~0.07 (±0.04)
- DSS: ~0.07 (±0.04)
- DBSS: ~0.07 (±0.04)
6. **Qwen-32b**:
- Baseline: ~0.11 (±0.07)
- BSS: ~0.05 (±0.03)
- DSS: ~0.05 (±0.03)
- DBSS: ~0.06 (±0.04)
### Key Observations
- **Baseline Dominance**: Baseline sycophancy rates are consistently highest across all models, with LLaMA-8b showing the peak (~0.34).
- **Method Effectiveness**: BSS, DSS, and DBSS reduce sycophancy by ~80-90% compared to Baseline. DBSS slightly outperforms BSS/DSS in LLaMA-8b and Qwen-32b.
- **Model Size Correlation**: Larger models (LLaMA-8b, Qwen-32b) exhibit higher Baseline sycophancy than smaller models (Qwen-3b, Qwen-14b).
- **Qwen Consistency**: Qwen models show minimal variation in sycophancy rates across methods, suggesting architectural robustness.
### Interpretation
The data demonstrates that:
1. **Model Size Matters**: Larger models (LLaMA-8b, Qwen-32b) exhibit higher inherent sycophancy in Baseline configurations, potentially due to increased capacity for pattern-matching or overfitting.
2. **Method Impact**: BSS, DSS, and DBSS significantly mitigate sycophancy, with DBSS showing marginal improvements in larger models. This suggests these methods effectively constrain model behavior without sacrificing utility.
3. **Qwen Advantage**: Qwen models consistently show lower sycophancy rates than LLaMA models, even at similar sizes. This could indicate architectural differences (e.g., training data, regularization) that inherently reduce sycophantic tendencies.
4. **Error Bar Trends**: Larger models (LLaMA-8b, Qwen-32b) have wider error bars, implying greater variability in sycophancy measurements, possibly due to more complex decision boundaries.
The findings highlight the importance of method selection (BSS/DSS/DBSS) in reducing sycophancy, particularly for larger models. Qwen's lower baseline rates suggest it may be a preferable choice for applications requiring minimal sycophantic behavior.