## Line Chart: Parallel vs. Sequential Scaling: MATH-500
### Overview
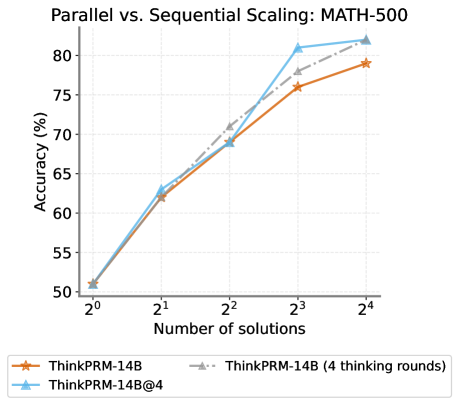
The chart compares the accuracy of three model configurations (ThinkPRM-14B, ThinkPRM-14B with 4 thinking rounds, and ThinkPRM-14B@4) across different numbers of solutions (2⁰ to 2⁴). Accuracy is measured in percentage, with the x-axis representing the number of solutions and the y-axis representing accuracy. The chart highlights trends in performance as the number of solutions increases.
### Components/Axes
- **X-axis (Number of solutions)**: Labeled with powers of 2 (2⁰, 2¹, 2², 2³, 2⁴), corresponding to 1, 2, 4, 8, 16 solutions.
- **Y-axis (Accuracy %)**: Ranges from 50% to 80% in 5% increments.
- **Legend**: Located at the bottom, with three entries:
- **Orange (solid line)**: ThinkPRM-14B
- **Gray (dashed line)**: ThinkPRM-14B (4 thinking rounds)
- **Blue (solid line)**: ThinkPRM-14B@4
### Detailed Analysis
#### ThinkPRM-14B (Orange Solid Line)
- **2⁰ (1 solution)**: ~50.5%
- **2¹ (2 solutions)**: ~62.5%
- **2² (4 solutions)**: ~69%
- **2³ (8 solutions)**: ~76%
- **2⁴ (16 solutions)**: ~78%
- **Trend**: Gradual upward slope, with diminishing returns as the number of solutions increases.
#### ThinkPRM-14B (4 thinking rounds) (Gray Dashed Line)
- **2⁰ (1 solution)**: ~50.5%
- **2¹ (2 solutions)**: ~63%
- **2² (4 solutions)**: ~70%
- **2³ (8 solutions)**: ~77%
- **2⁴ (16 solutions)**: ~80%
- **Trend**: Steeper upward slope than the orange line, with consistent improvement across all solution counts.
#### ThinkPRM-14B@4 (Blue Solid Line)
- **2⁰ (1 solution)**: ~50.5%
- **2¹ (2 solutions)**: ~63.5%
- **2² (4 solutions)**: ~69%
- **2³ (8 solutions)**: ~82%
- **2⁴ (16 solutions)**: ~83%
- **Trend**: Sharp upward spike between 2² and 2³, followed by a plateau. Highest accuracy at all solution counts.
### Key Observations
1. **Initial Parity**: All three models start at ~50.5% accuracy at 2⁰ (1 solution).
2. **Performance Divergence**:
- ThinkPRM-14B@4 (blue) outperforms the other two models at higher solution counts (e.g., 82% vs. 77% at 2³).
- ThinkPRM-14B (orange) shows the slowest growth, with only a 28% increase from 2⁰ to 2⁴.
3. **Parallel Scaling Advantage**: The blue line (ThinkPRM-14B@4) suggests that parallel scaling (e.g., 4 thinking rounds) significantly improves accuracy compared to sequential scaling (orange line).
### Interpretation
The chart demonstrates that **parallel scaling** (ThinkPRM-14B@4) achieves higher accuracy than sequential scaling (ThinkPRM-14B) as the number of solutions increases. The gray dashed line (4 thinking rounds) bridges the gap between the two, indicating that adding computational resources (e.g., thinking rounds) enhances performance. The sharp rise in the blue line at 2³ (8 solutions) suggests that parallel processing may unlock non-linear gains, while the orange line’s plateau highlights the limitations of sequential scaling. This aligns with the title’s focus on comparing scaling strategies, emphasizing the efficiency of parallel approaches for complex tasks like MATH-500.