\n
## Line Chart: Parallel vs. Sequential Scaling: MATH-300
### Overview
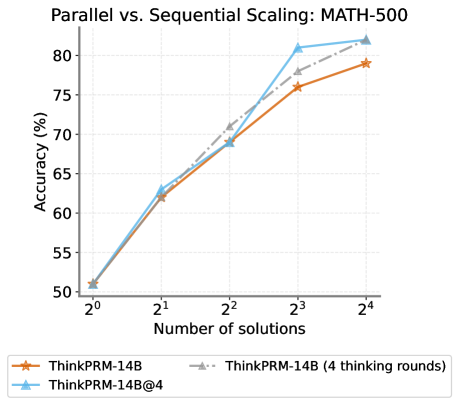
This line chart compares the accuracy of different models (ThinkPRM-14B and ThinkPRM-14B@4) on the MATH-300 dataset as the number of solutions increases. The x-axis represents the number of solutions (on a logarithmic scale), and the y-axis represents the accuracy in percentage. The chart shows how accuracy changes with the number of solutions for each model, with and without multiple "thinking rounds".
### Components/Axes
* **Title:** Parallel vs. Sequential Scaling: MATH-300
* **X-axis Label:** Number of solutions
* **X-axis Scale:** Logarithmic scale, with markers at 2⁰, 2¹, 2², 2³, and 2⁴.
* **Y-axis Label:** Accuracy (%)
* **Y-axis Scale:** Linear scale, ranging from approximately 50% to 82%.
* **Legend:** Located at the bottom-center of the chart.
* ThinkPRM-14B (Orange line with star marker)
* ThinkPRM-14B (4 thinking rounds) (Gray dashed line with triangle marker)
* ThinkPRM-14B@4 (Blue line with circle marker)
### Detailed Analysis
The chart displays three lines representing the accuracy of different models as the number of solutions increases.
* **ThinkPRM-14B (Orange):** This line starts at approximately 51% accuracy at 2⁰ solutions. It increases steadily, reaching approximately 77% accuracy at 2⁴ solutions. The trend is generally upward, but the slope decreases as the number of solutions increases.
* 2⁰: ~51%
* 2¹: ~62%
* 2²: ~68%
* 2³: ~79%
* 2⁴: ~78%
* **ThinkPRM-14B (4 thinking rounds) (Gray):** This line begins at approximately 51% accuracy at 2⁰ solutions. It rises more rapidly than the orange line, reaching approximately 81% accuracy at 2³ solutions, and plateaus at approximately 81% at 2⁴ solutions.
* 2⁰: ~51%
* 2¹: ~64%
* 2²: ~71%
* 2³: ~81%
* 2⁴: ~81%
* **ThinkPRM-14B@4 (Blue):** This line starts at approximately 51% accuracy at 2⁰ solutions. It increases rapidly, surpassing the other two lines, and reaches approximately 82% accuracy at 2³ solutions. It plateaus at approximately 81% at 2⁴ solutions.
* 2⁰: ~51%
* 2¹: ~64%
* 2²: ~72%
* 2³: ~82%
* 2⁴: ~81%
### Key Observations
* All three models start with similar accuracy at 2⁰ solutions.
* The models with "4 thinking rounds" (gray and blue lines) consistently outperform the base model (orange line) as the number of solutions increases.
* The ThinkPRM-14B@4 model achieves the highest accuracy, particularly at lower numbers of solutions (2⁰ to 2³).
* Accuracy plateaus for all models at higher numbers of solutions (2⁴).
### Interpretation
The data suggests that increasing the number of "thinking rounds" significantly improves the accuracy of the ThinkPRM-14B model on the MATH-300 dataset. The ThinkPRM-14B@4 model demonstrates the most substantial improvement, indicating that parallel scaling (represented by "@4") combined with multiple thinking rounds is highly effective. The plateau in accuracy at higher numbers of solutions suggests that there is a diminishing return from adding more solutions beyond a certain point. This could be due to the inherent limitations of the model or the dataset itself. The logarithmic scale on the x-axis emphasizes the rapid gains in accuracy achieved with a relatively small increase in the number of solutions, especially in the early stages. The fact that all lines start at the same point suggests that the initial performance is similar across all configurations, and the differences emerge as the models are given more opportunities to refine their solutions.