## Diagram: State Transition Diagram of 'Alive' Status
### Overview
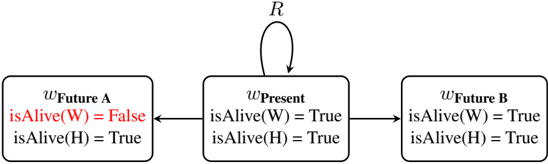
The image is a state transition diagram illustrating the possible states of an entity's 'alive' status across different time points (Present, Future A, Future B). The diagram shows transitions between these states, with conditions associated with each state. The diagram includes three states represented by rounded rectangles and transitions between them represented by arrows.
### Components/Axes
* **States:**
* `wFuture A`: Represents a future state A.
* `isAlive(W) = False` (in red)
* `isAlive(H) = True`
* `wPresent`: Represents the present state.
* `isAlive(W) = True`
* `isAlive(H) = True`
* `wFuture B`: Represents a future state B.
* `isAlive(W) = True`
* `isAlive(H) = True`
* **Transitions:**
* An arrow points from `wPresent` to `wFuture B`.
* An arrow points from `wPresent` to `wFuture A`.
* A curved arrow labeled `R` loops from `wPresent` back to itself.
### Detailed Analysis
* **State `wFuture A` (Left):**
* Located on the left side of the diagram.
* `isAlive(W)` is `False` (displayed in red).
* `isAlive(H)` is `True`.
* **State `wPresent` (Center):**
* Located in the center of the diagram.
* `isAlive(W)` is `True`.
* `isAlive(H)` is `True`.
* Has a self-loop transition labeled `R`.
* **State `wFuture B` (Right):**
* Located on the right side of the diagram.
* `isAlive(W)` is `True`.
* `isAlive(H)` is `True`.
* **Transitions:**
* The transition from `wPresent` to `wFuture B` indicates a change from the present state to a future state where both `W` and `H` are alive.
* The transition from `wPresent` to `wFuture A` indicates a change from the present state to a future state where `W` is not alive, but `H` is.
* The self-loop on `wPresent` labeled `R` suggests a return or repetition of the present state.
### Key Observations
* The diagram focuses on the 'alive' status of two entities, `W` and `H`.
* The status of `H` remains `True` across all states.
* The status of `W` changes from `True` in the present to `False` in `wFuture A`, and remains `True` in `wFuture B`.
### Interpretation
The diagram models the possible future states of entities `W` and `H` based on their current 'alive' status. It shows that while `H` remains alive in all future states considered, `W` may or may not be alive in the future. The transition from the present to `wFuture A` suggests a scenario where `W` dies, while the transition to `wFuture B` suggests a scenario where `W` remains alive. The self-loop on the present state indicates that the current state can persist. The diagram could represent a simplified model of mortality or a more abstract concept where 'alive' represents a different attribute.