## Line Chart: Training Loss
### Overview
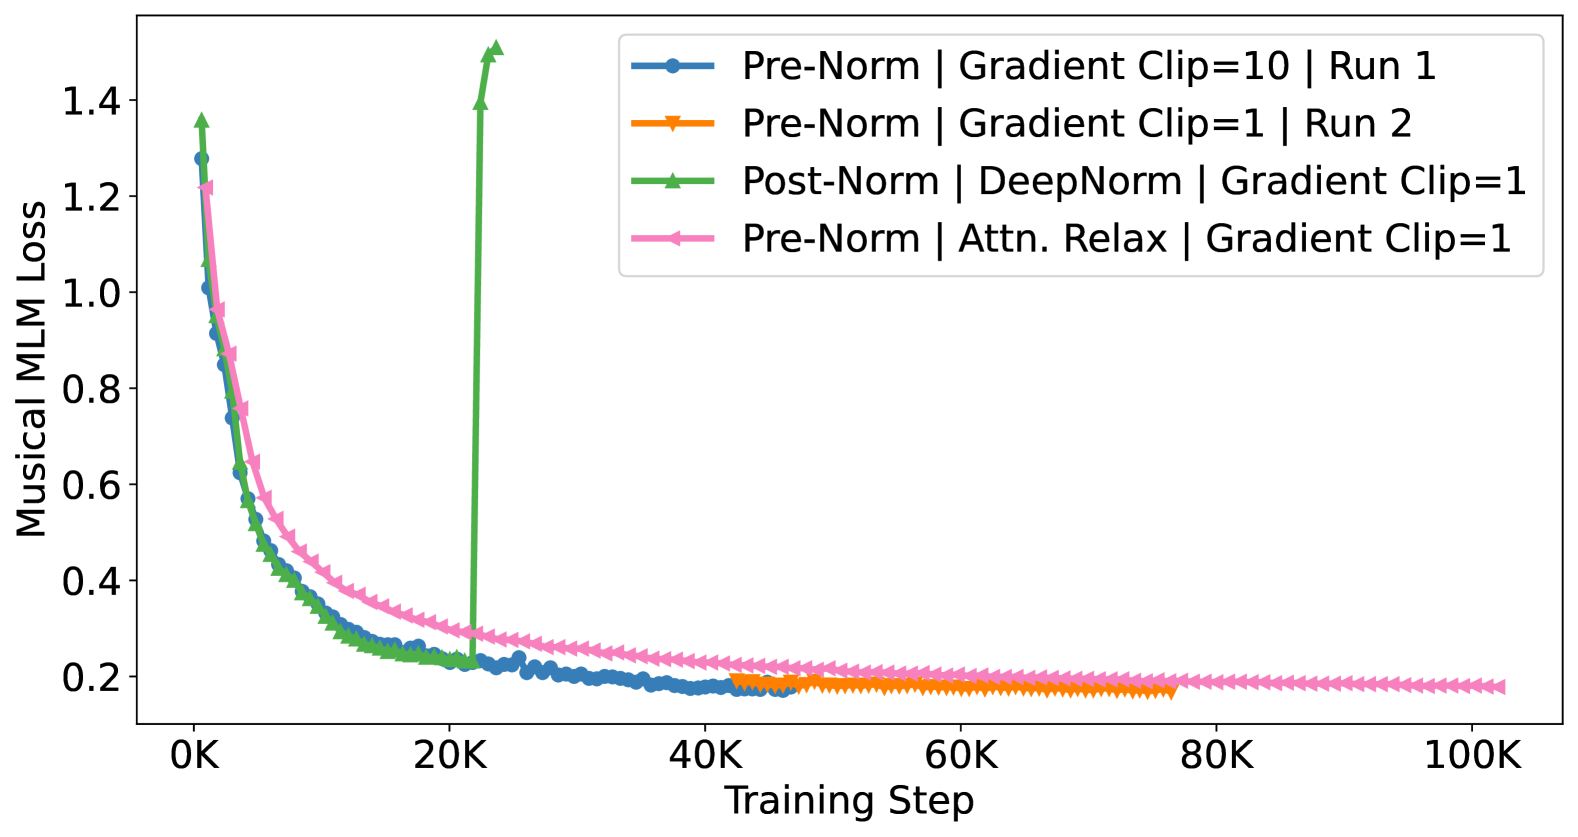
The line chart displays the training loss of a model over 100,000 training steps. The loss is measured in terms of Musical Loss, which is a metric used to evaluate the performance of a model in generating musical sequences.
### Components/Axes
- **X-axis (Training Step)**: Represents the number of training steps, ranging from 0 to 100,000.
- **Y-axis (Musical Loss)**: Represents the loss value, ranging from 0 to 1.4.
- **Legend**: Contains four lines, each representing a different training method or configuration.
- **Pre-Norm | Gradient Clip=10 | Run 1**: Blue line with a gradient clip of 10.
- **Pre-Norm | Gradient Clip=1 | Run 2**: Orange line with a gradient clip of 1.
- **Post-Norm | DeepNorm | Gradient Clip=1**: Green line with deep normalization and a gradient clip of 1.
- **Pre-Norm | Attn. Relax | Gradient Clip=1**: Pink line with attention relaxation and a gradient clip of 1.
### Detailed Analysis
- The **Pre-Norm** methods (blue and orange lines) show a significant decrease in loss initially, but the loss plateaus after a few thousand steps.
- The **Post-Norm** method (green line) shows a more gradual decrease in loss, which then stabilizes.
- The **Pre-Norm | Attn. Relax** method (pink line) shows a similar trend to the **Pre-Norm | Gradient Clip=10** method, with a slight plateau after the initial decrease.
### Key Observations
- The **Post-Norm** method consistently shows the lowest loss throughout the training process.
- The **Pre-Norm** methods show a similar trend, with the **Pre-Norm | Gradient Clip=10** method having a slightly lower loss than the **Pre-Norm | Gradient Clip=1** method.
- The **Pre-Norm | Attn. Relax** method shows a similar trend to the **Pre-Norm | Gradient Clip=10** method, with a slight plateau after the initial decrease.