## Bar Chart with Line Graph: Model Performance Comparison
### Overview
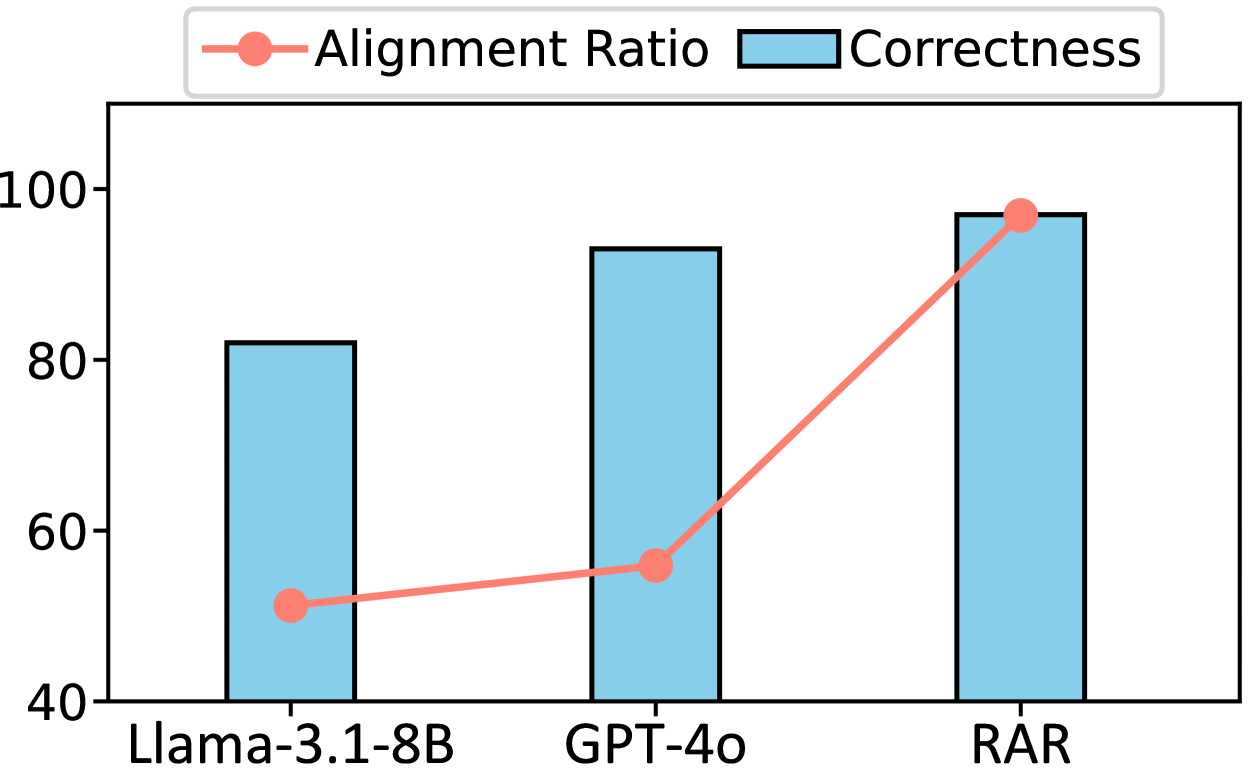
The image is a bar chart with an overlaid line graph comparing three AI models: Llama-3.1-8B, GPT-4o, and RAR. Two metrics are visualized: "Alignment Ratio" (red line with circular markers) and "Correctness" (blue bars). The y-axis ranges from 40 to 100, while the x-axis lists the models.
### Components/Axes
- **X-axis**: Labeled with model names (Llama-3.1-8B, GPT-4o, RAR) in ascending order.
- **Y-axis**: Labeled "Values" with increments of 20 (40, 60, 80, 100).
- **Legend**: Located in the top-left corner, with:
- Red line/circle: "Alignment Ratio"
- Blue bar: "Correctness"
### Detailed Analysis
1. **Llama-3.1-8B**:
- **Correctness**: Blue bar reaches approximately 82.
- **Alignment Ratio**: Red dot positioned at ~50.
2. **GPT-4o**:
- **Correctness**: Blue bar reaches approximately 93.
- **Alignment Ratio**: Red dot positioned at ~57.
3. **RAR**:
- **Correctness**: Blue bar reaches approximately 98.
- **Alignment Ratio**: Red dot positioned at ~98.
### Key Observations
- **Trend Verification**:
- The red line (Alignment Ratio) slopes upward consistently across all models, indicating a positive correlation with model performance.
- Blue bars (Correctness) also increase from Llama-3.1-8B to RAR, showing improved performance in this metric.
- **Spatial Grounding**:
- The legend is positioned in the top-left corner, clearly associating colors with metrics.
- Red dots align closely with the blue bars for RAR, suggesting near-identical values for both metrics.
### Interpretation
The data demonstrates that **RAR** outperforms the other models in both "Correctness" and "Alignment Ratio," achieving near-parity between the two metrics. The upward trend of the red line suggests that higher correctness scores correlate with improved alignment ratios across all models. Notably, Llama-3.1-8B shows the largest gap between correctness (82) and alignment ratio (50), while RAR minimizes this gap, indicating a more balanced performance. This could imply that RAR’s architecture or training prioritizes both accuracy and alignment with desired outputs more effectively than the other models.