\n
## Bar and Line Chart: Alignment Ratio vs. Correctness
### Overview
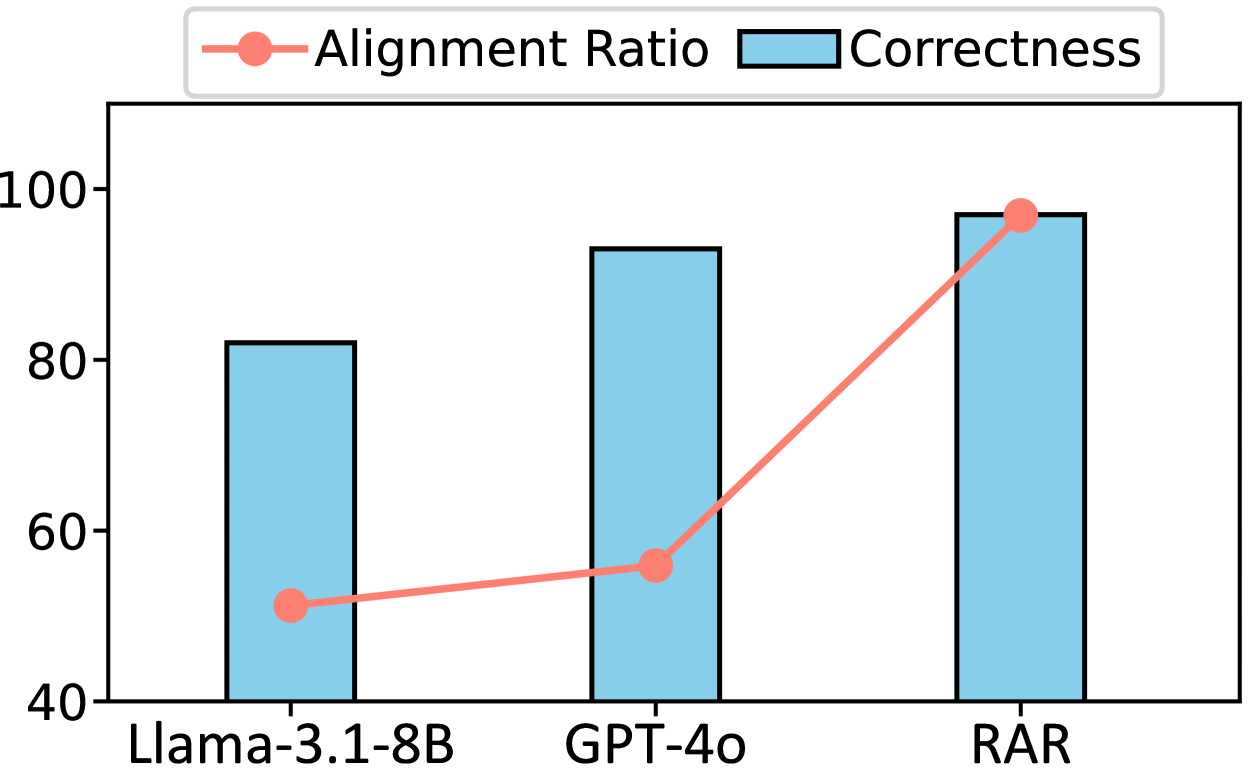
This image presents a bar chart comparing the "Correctness" of three models (Llama-3.1-8B, GPT-4o, and RAR) alongside a line chart showing the "Alignment Ratio" for the same models. The x-axis represents the model names, while the y-axis represents the values for both metrics, ranging from approximately 40 to 100.
### Components/Axes
* **X-axis:** Model Name (Llama-3.1-8B, GPT-4o, RAR)
* **Y-axis:** Value (ranging from approximately 40 to 100, no specific units are given)
* **Bar Chart:** Represents "Correctness" with light blue bars.
* **Line Chart:** Represents "Alignment Ratio" with a red line and circular markers.
* **Legend:** Located in the top-right corner, defining the colors for "Alignment Ratio" (red) and "Correctness" (light blue).
### Detailed Analysis
The chart displays the following data:
* **Llama-3.1-8B:**
* Correctness: Approximately 82.
* Alignment Ratio: Approximately 51.
* **GPT-4o:**
* Correctness: Approximately 93.
* Alignment Ratio: Approximately 64.
* **RAR:**
* Correctness: Approximately 98.
* Alignment Ratio: Approximately 95.
**Trends:**
* **Correctness:** The "Correctness" bars show an increasing trend from Llama-3.1-8B to GPT-4o to RAR.
* **Alignment Ratio:** The red line representing "Alignment Ratio" also shows a clear upward trend, starting at approximately 51 for Llama-3.1-8B, rising to approximately 64 for GPT-4o, and reaching approximately 95 for RAR.
### Key Observations
* RAR demonstrates the highest values for both "Correctness" and "Alignment Ratio".
* Llama-3.1-8B has the lowest values for both metrics.
* The gap between "Correctness" and "Alignment Ratio" appears to narrow as the model improves (moving from Llama-3.1-8B to RAR).
### Interpretation
The chart suggests a positive correlation between "Correctness" and "Alignment Ratio". As models become more accurate ("Correctness" increases), their alignment with desired behaviors or values ("Alignment Ratio") also tends to improve. RAR appears to be the most aligned and correct model among the three tested. The significant increase in both metrics from Llama-3.1-8B to GPT-4o and then to RAR indicates that improvements in model architecture, training data, or alignment techniques can lead to substantial gains in both accuracy and alignment. The data implies that achieving high "Correctness" does not automatically guarantee high "Alignment Ratio", but improvements in one often accompany improvements in the other. The chart does not provide information on *how* these metrics are calculated or what constitutes "alignment" in this context, which limits a deeper understanding of the underlying relationships.