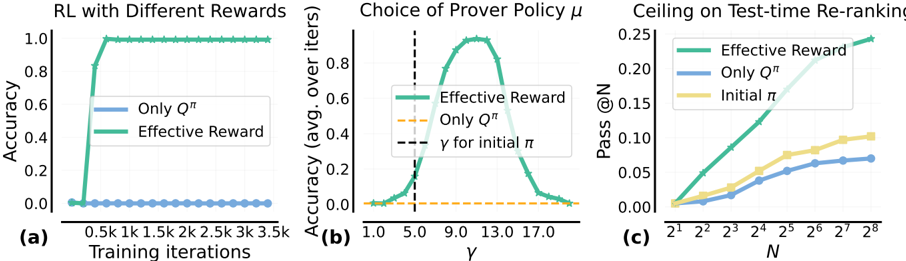
## Chart: RL Performance with Different Rewards and Prover Policies
### Overview
The image presents three line charts comparing the performance of reinforcement learning (RL) agents under different reward structures and prover policies. The charts illustrate the accuracy and pass rates achieved by the agents as a function of training iterations, policy parameter γ, and the number of samples N.
### Components/Axes
**Chart (a): RL with Different Rewards**
* **Title:** RL with Different Rewards
* **X-axis:** Training iterations (0.5k, 1k, 1.5k, 2k, 2.5k, 3k, 3.5k)
* **Y-axis:** Accuracy (0.0, 0.2, 0.4, 0.6, 0.8, 1.0)
* **Legend:**
* Blue: Only Q<sup>π</sup>
* Green: Effective Reward
**Chart (b): Choice of Prover Policy μ**
* **Title:** Choice of Prover Policy μ
* **X-axis:** γ (1.0, 5.0, 9.0, 13.0, 17.0)
* **Y-axis:** Accuracy (avg. over iters) (0.0, 0.2, 0.4, 0.6, 0.8)
* **Legend:**
* Green: Effective Reward
* Orange: Only Q<sup>π</sup>
* Black dashed line: γ for initial π
**Chart (c): Ceiling on Test-time Re-ranking**
* **Title:** Ceiling on Test-time Re-ranking
* **X-axis:** N (2<sup>1</sup>, 2<sup>2</sup>, 2<sup>3</sup>, 2<sup>4</sup>, 2<sup>5</sup>, 2<sup>6</sup>, 2<sup>7</sup>, 2<sup>8</sup>)
* **Y-axis:** Pass @N (0.00, 0.05, 0.10, 0.15, 0.20, 0.25)
* **Legend:**
* Green: Effective Reward
* Blue: Only Q<sup>π</sup>
* Yellow: Initial π
### Detailed Analysis
**Chart (a): RL with Different Rewards**
* **Only Q<sup>π</sup> (Blue):** The accuracy remains consistently low, near 0.0, across all training iterations.
* **Effective Reward (Green):** The accuracy rapidly increases to 1.0 within the first 0.5k training iterations and remains at 1.0 for the rest of the training period.
**Chart (b): Choice of Prover Policy μ**
* **Effective Reward (Green):** The accuracy starts near 0.0 at γ = 1.0, increases to a peak of approximately 0.9 at γ ≈ 11.0, and then decreases back to near 0.0 at γ = 17.0.
* **Only Q<sup>π</sup> (Orange):** The accuracy remains constant at approximately 0.02 across all values of γ.
* **Vertical Dashed Line (Black):** Indicates the value of γ for the initial policy π, located at γ = 5.0.
**Chart (c): Ceiling on Test-time Re-ranking**
* **Effective Reward (Green):** The pass rate increases steadily from approximately 0.01 at N = 2<sup>1</sup> to approximately 0.24 at N = 2<sup>8</sup>.
* **Only Q<sup>π</sup> (Blue):** The pass rate increases from approximately 0.01 at N = 2<sup>1</sup> to approximately 0.07 at N = 2<sup>8</sup>. The rate of increase slows down as N increases.
* **Initial π (Yellow):** The pass rate increases from approximately 0.01 at N = 2<sup>1</sup> to approximately 0.10 at N = 2<sup>8</sup>. The rate of increase slows down as N increases.
### Key Observations
* The "Effective Reward" consistently outperforms "Only Q<sup>π</sup>" in all three scenarios.
* In chart (b), the accuracy of the "Effective Reward" policy is highly sensitive to the choice of γ, with a clear peak around γ = 11.0.
* In chart (c), the "Effective Reward" policy shows a significantly higher pass rate as N increases compared to the other policies.
### Interpretation
The data suggests that using an "Effective Reward" structure in reinforcement learning leads to significantly better performance compared to using "Only Q<sup>π</sup>". The choice of the policy parameter γ is crucial for the "Effective Reward" policy, as it greatly affects the accuracy of the agent. The "Effective Reward" policy also demonstrates a higher ceiling on test-time re-ranking, indicating its ability to generalize better as the number of samples increases. The "Only Q<sup>π</sup>" policy appears to be less effective and less sensitive to the parameters tested.